The Heartbeat of the Market
You might recall the alarmist headlines a few years ago when various financial media outlets reported the Federal Reserve’s reverse repo facility surpassed $1 trillion. If you were confused about the significance—wondering what a repo is, let alone one in reverse—it’s important to understand, especially given the recent market talk of a crisis in what’s considered the ‘heartbeat of the market’.
A repurchase agreement (repo) is essentially a short-term collateralized loan, typically secured by government debt or Mortgage-Backed Securities (MBS). Imagine this: if you’re an institution in need of short-term liquidity, you might pledge some of your High-Quality Liquid Assets (HQLAs) in exchange for a short-term credit facility. The collateral, often government securities, is valued for its predictability and liquidity, critical in case of borrower default. You’ll often hear about the ‘haircut’ in repo terms, referring to the excess value of the collateral compared to the loan amount—this protects lenders from declines in collateral value. Now, consider the reverse repo, where securities are purchased with an agreement to sell them back at a higher price on a future date. In the context of repos, this is viewed from the borrower’s perspective, where they pledge securities for cash. In a reverse repo, the transaction is seen from the lender’s side, providing cash in exchange for securities as collateral.
There are renewed concerns about a potential repeat of the 2019 repo crisis, which compelled the Federal Reserve to instruct its New York branch to inject billions of dollars into the repo market. These operations are ongoing, with an expanded scope that now includes two-week lending in addition to overnight repo, and have also increased in size. Select factors that participants believe are contributing to the recent fears of a potential repo market breakdown are as follows:
Increased Repo Activity: There has been a surge in repo activity, likely adding to funding pressures in the market, particularly during critical periods such as quarter- and year-ends.
Balance Sheet Costs: Banks tend to reduce their participation in the repo market at quarter- and year-ends due to the higher balance sheet costs during these periods, which can lead to liquidity shortages and rate spikes.
Historical Context: The current situation resembles the repo market disruption in September 2019, when repo interest rates spiked significantly, prompting the Federal Reserve to inject approximately $350 billion to stabilize the market.
Regulatory Changes: New SEC regulations will require central clearing for cash and repo transactions in U.S. Treasury securities by June 2026. While these rules aim to improve transparency and stability, they could introduce new challenges for the market.
We have long believed funding markets are determined by 3 key fundamentals: cash, collateral, & dealer sheet capacity. We attributed last week’s funding spike to the latter 2 factors. We overlooked extent of cash drain in contributing to the pressure. The increased sensitivity of cash to SOFR hints of LCLoR.
The Federal Reserve has long debated the minimum reserves banks need, known as the "Lowest Comfortable Level of Reserves" (LCLoR). Initially, in 2018, the Fed estimated the LCLoR at $617 billion based on a bank survey. However, this estimate became unreliable after the 2019 repo market turmoil, when reserves were around $1.5 trillion. Since then, the Fed has used pre-pandemic reserve levels as a benchmark, estimating the LCLoR at 8% of nominal GDP. Currently, this translates to approximately $2 trillion. Cabana believes based on recent funding volume evidence that the LCLoR currently stands at $3-3.25 trillion. The consequence of reaching this bound or getting very close to it is banks are less willing to lend excess reserves in the repo market. This reluctance can result in a shortage of available liquidity in the repo market, driving up secured rates such as SOFR as borrowers struggle to source funds.

Get your news from the future.
The Oracle by Polymarket is news with skin in the game. This weekly newsletter gives you insights on global headlines from the world’s largest prediction market, powered by traders around the world with millions of dollars on the line. Every week, we break down how the market is interpreting major events—whether it’s politics, culture, or global news. See into the future with real-time odds from traders around the world who are betting on the future.

SOFR Spikes
Funding Pressures in The Repo Market
A great indicator of stress in repo markets is a volatile move in short-term funding rates such as SOFR (the replacement for the now-defunct LIBOR). A spike in repo rates typically indicates that there is not enough cash available relative to the demand for short term secured borrowing. This scarcity of liquidity can create funding pressures for financial institutions that rely on the repo market for funding that maturity.
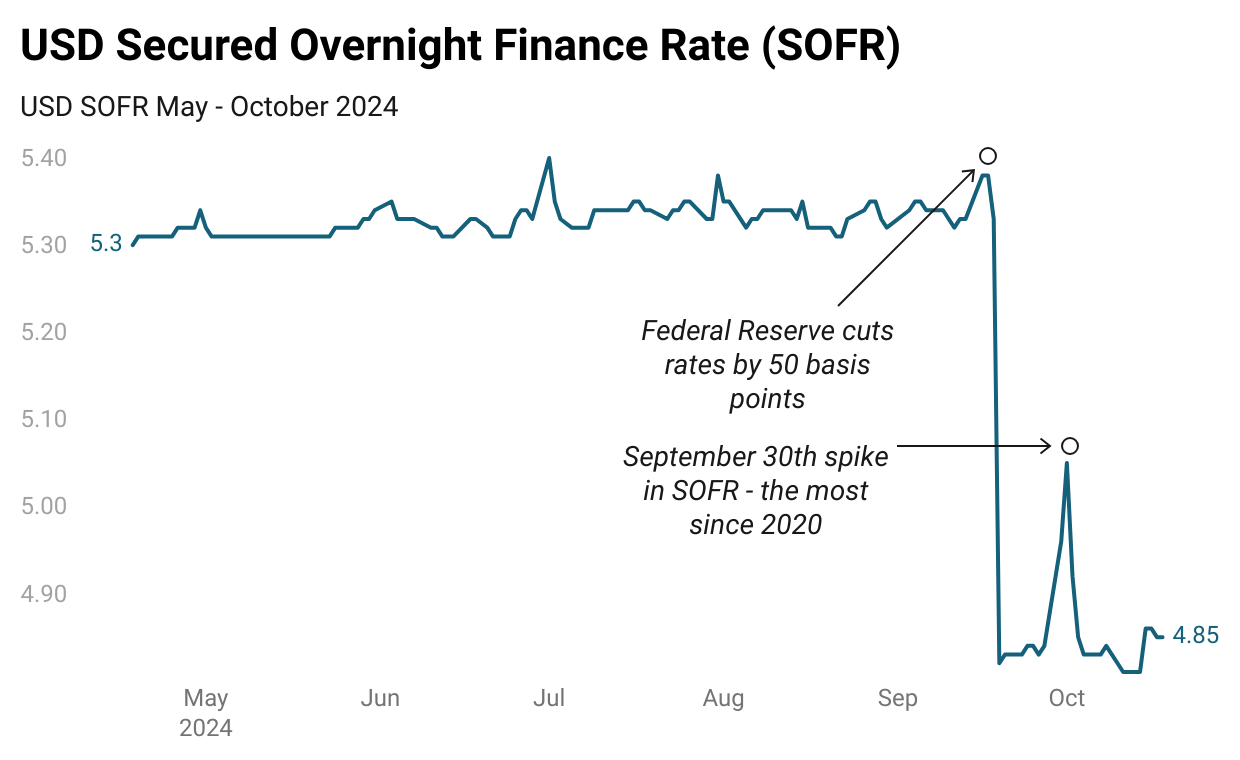
This surge in repo rates often signals a scarcity of cash and tight liquidity. Other than the move in SOFR shortly after the Federal Reserve reduced the overnight rate by 50 bps, the change on Monday, September 30, stands as the single largest move since 2020. SOFR climbed to 4.96% at the start of October, up from 4.84% at the end of the previous week on September 27, according to data from the Federal Reserve Bank of New York.
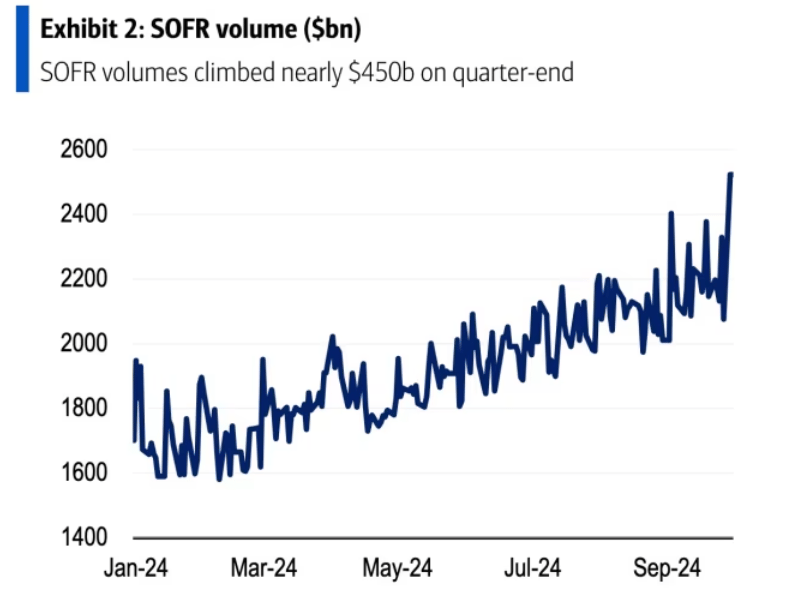
According to a report by Reuters in early October, "Repo rates normally trade higher at quarter-ends as balance sheet reporting prompts dealers to reduce their matched book activity," Joseph Abate, an interest rate strategist at Barclays, said in a note. That same Monday, the Federal Reserve's standing repo facility, which lets eligible firms exchange Treasuries or other securities for cash, recorded $2.6 billion in lending. This marked the first time daily lending exceeded $200 million since the SRF was introduced in 2021 according to Reuters as seen in the graphic from Bloomberg below.
What Does it Mean?
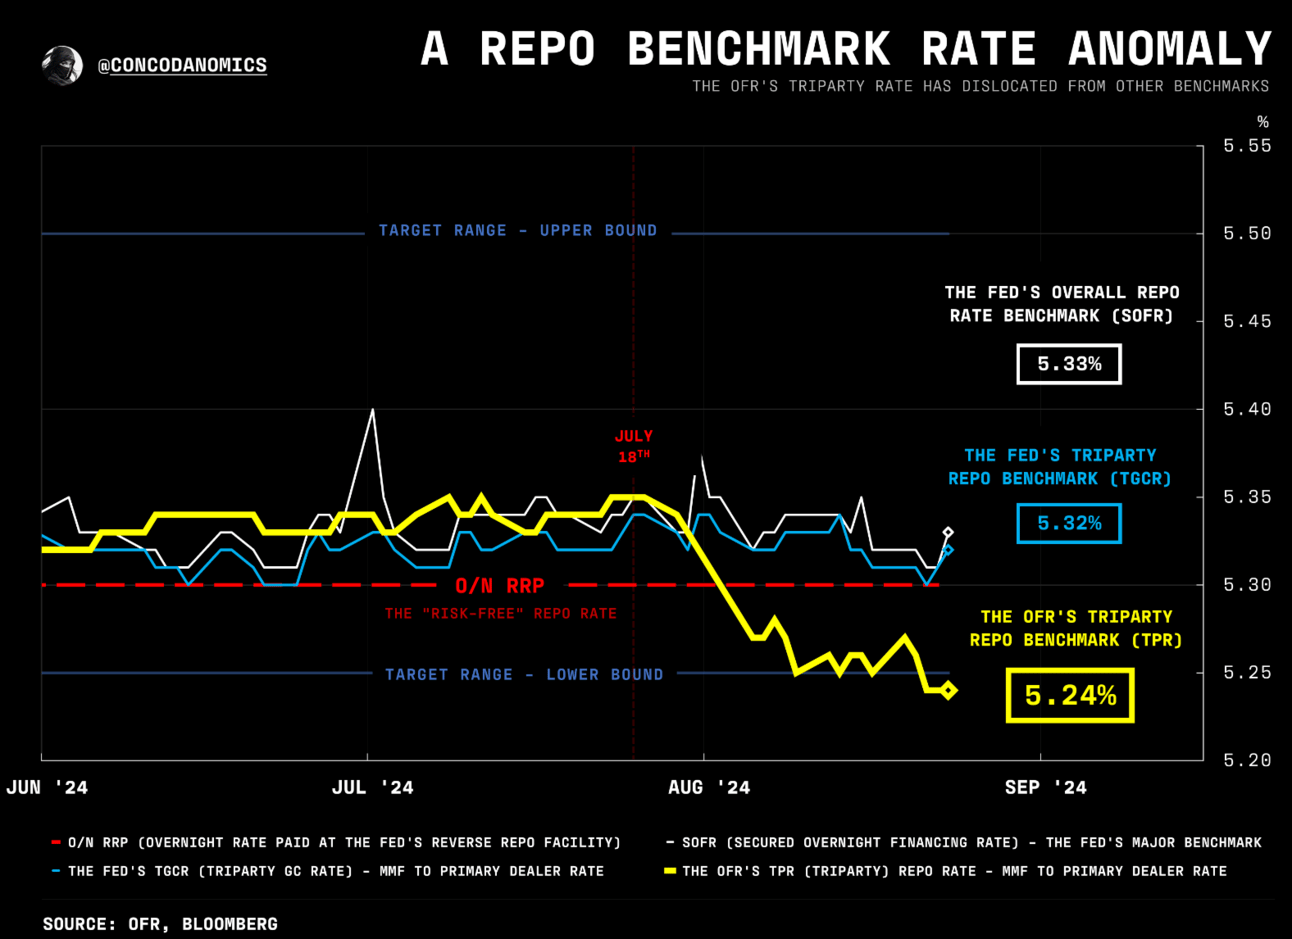
What does a sudden quarter-end spike in SOFR and a significant increase in volumes signify? It likely indicates that institutional reserves are leaving the system, as mentioned by Bank of America in the previous section. The newsletter Conks Plumbing, which focuses on monetary plumbing, notes an interesting observation regarding recent developments in the repo market: since July 18th, the two key benchmarks for measuring triparty repo rates—the rates at which the Fed’s primary dealers borrow dollars from cash investors via repos—have diverged. The Federal Reserve’s average triparty measure, TGCR, has remained within its typical tight range, while the TPR rate, the triparty benchmark published by the Office of Financial Research (OFR), has rapidly declined (as shown below in yellow).
The declining TPR rate, combined with a stable TGCR, suggests that cash investors are becoming more selective or cautious about lending in the repo market, resulting in diminished liquidity. This lack of liquidity can exacerbate volatility and instability. It reflects excessive demand for reserves chasing too few available reserves, leading to a spike in secured rates. Such disruptions in money markets could mirror the events of 2019.

What Can We Learn From the 2019 Crisis?
Contributing Factors
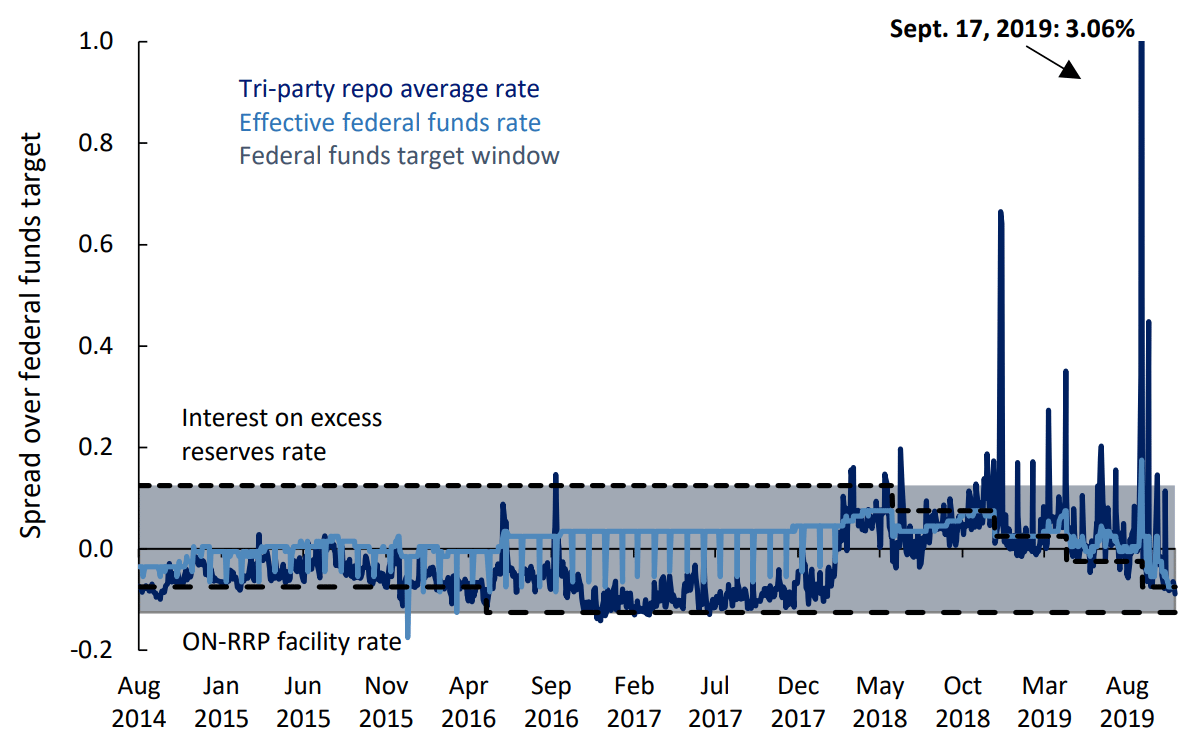
The September 2019 repo crisis marked a pivotal moment in the U.S. financial markets, revealing significant vulnerabilities within the repo market. On September 17, 2019, the Secured Overnight Financing Rate experienced a dramatic spike, soaring from 2.43% on September 16 to 5.25%. During that trading day, interest rates reached unprecedented levels, climbing as high as 10%. This surge was particularly alarming given that repo rates typically align closely with the Federal Reserve's interest rate on excess reserves, highlighting the unusual nature of this event.
Several factors contributed to the spike in repo rates. First, quarterly corporate tax payments due on September 16 led to substantial cash withdrawals from the banking system, tightening liquidity. Additionally, the settlement of $78 billion in government debt on the same day further intensified the demand for cash. Compounding these issues, bank reserves were at their lowest level since 2011, with only $1.4 trillion available in the system. Regulatory changes instituted following the 2008 financial crisis may have also made banks more reluctant to lend in the repo market, exacerbating the situation. The segmented structure of the repo market added to its fragility, creating conditions ripe for instability.
The paper below emphasizes that, although the crisis was sudden, it was rooted in several underlying factors that alone would not have caused such a spike in secured rates and declining reserves. A significant finding of the research presented is the identification of a disconnect between repo rates leading up to the event, similar to the discrepancies noted between the TPR and TCGR in July of this year in the previous section.
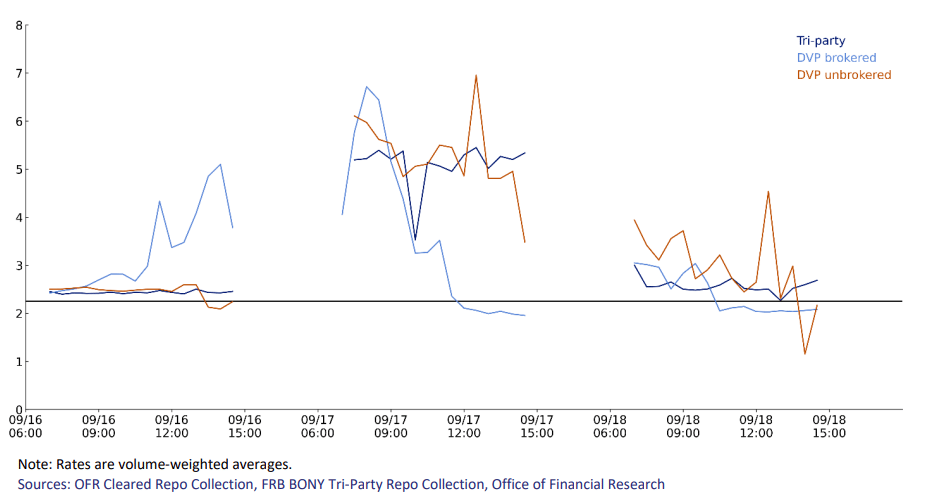
The authors of the paper found notable trends in the repo market from September 16 to September 18, specifically within the tri-party and DVP segments. As illustrated in Figure 12, the average rates across three different repo market segments include: (1) the tri-party market, a non-centrally cleared market primarily involving banks and money market funds (MMFs) lending to dealers; (2) the DVP-sponsored lending market, a centrally cleared market with MMFs lending to dealers; and (3) the DVP interdealer brokered market.
A key observation from these figures is that non-brokered rates, such as those offered by MMFs, did not align with interdealer rates during the 16th and 17th. In theory, a scarcity of reserves should prompt an increase in interest rates across various repo market segments to attract funds from available cash investors. However, on the afternoon of the 16th, despite the scarcity of cash in the market and rising rates in the DVP segment, MMFs continued to receive low returns on their repo investments, as indicated by the relatively stable tri-party rates throughout the day.
The Aftermath
In response to the crisis, the Federal Reserve implemented several measures to stabilize the market. On September 17, the Federal Reserve Bank of New York injected $75 billion in liquidity into the repo markets, a move that was followed by continued liquidity provision each morning for the rest of the week. Furthermore, on September 19, the Federal Open Market Committee lowered the interest paid on bank reserves to further ease monetary conditions.
The implications of the 2019 repo crisis were significant and far-reaching. It exposed critical vulnerabilities not only within the repo market but also in the broader financial system, underscoring the need for greater transparency in repo transactions. The event sparked discussions about potential policy changes and market structure reforms, particularly regarding the appropriate levels of bank reserves and the concept of "abundant reserves." While the crisis was ultimately resolved with the Fed's interventions, returning rates to stable levels by September 20, it left lingering questions about the functioning of the repo market and highlighted the necessity for structural changes to prevent similar crises in the future.

Anatomy of the Repo Rate Spikes in September 2019
This paper analyzes the dramatic spike in repo rates in mid-September 2019, utilizing unique intraday timing data from the repo market. It identifies a confluence of factors contributing to the volatility, noting that each factor alone would not have caused such disruption.
1.73 MB • PDF File

The Federal Reserve’s Responsibility
Hand On The Scale
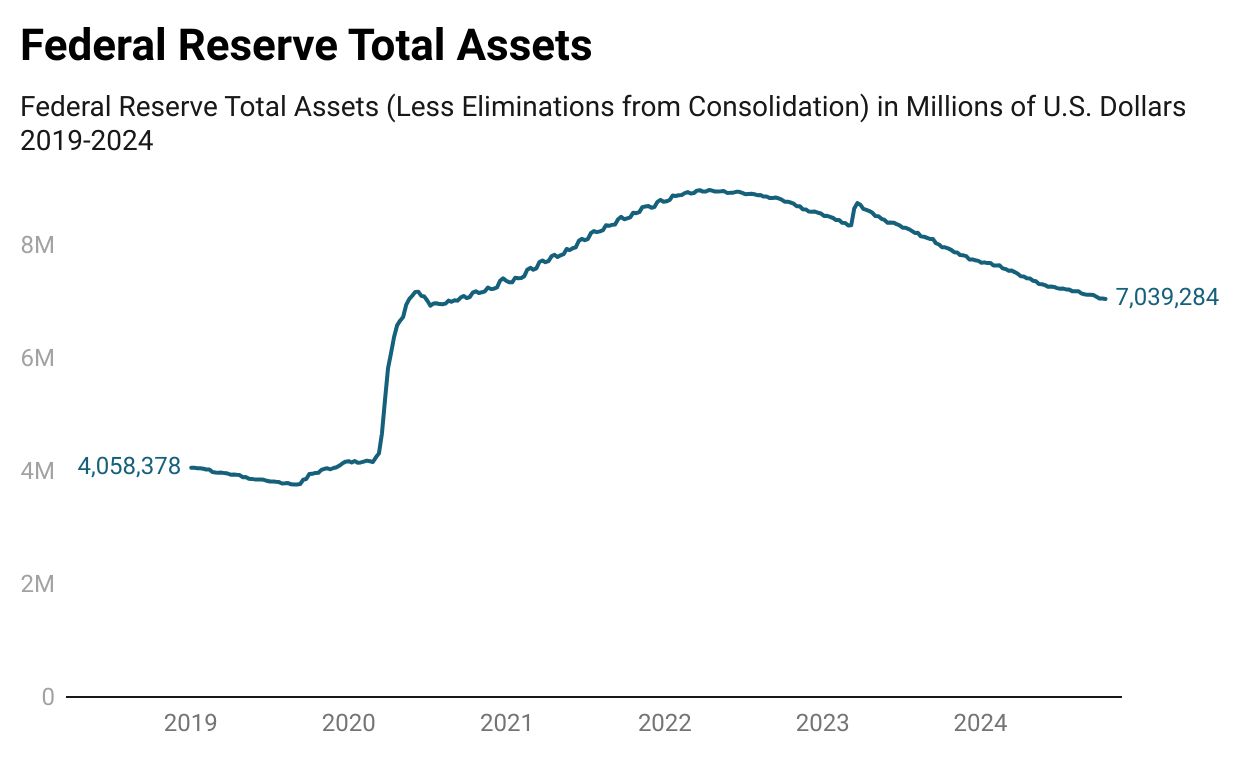
One might assume that the Federal Reserve would prefer to avoid injecting a substantial amount of liquidity into the system during a quantitative tightening phase, especially at the onset of a rate-cutting cycle. However, every policy decision has consequences. As the central bank continues to reduce the size of its balance sheet, bank reserves also decline. Jerome Powell has indicated that quantitative tightening (QT) will continue for several years as the Fed normalizes its balance sheet as shown in the figure below, a process that commonly follows periods of so called ‘easy money’.
The question remains: if the Fed is too late in diagnosing a potential issue, could we see a repeat of the 2019 episode, this time requiring even more liquidity support than five years ago? However, the central bank is aware of these pressures in the repo market, as highlighted in the September 26th speech titled "Balance Sheet Normalization: Monitoring Reserve Conditions and Understanding Repo Market Pressures".
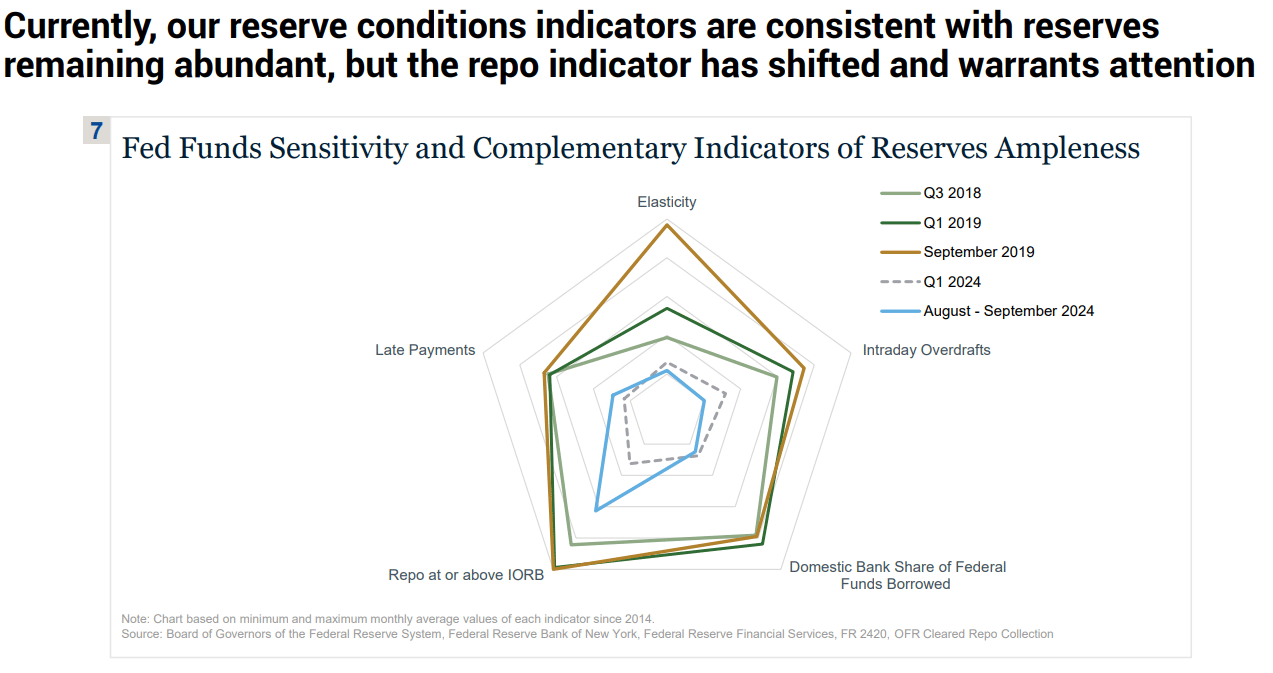
The Fed highlighted the importance of monitoring various reserve indicators, represented visually in a "spider chart" shown below comparing current reserves to historical levels from 2014 to the present. The chart shows that current reserve conditions are more abundant compared to the tightening period seen between Q3 2018 and September 2019. However, recent upward pressure on repo rates indicates a shift that warrants attention.
The Fed mentioned that they will continue closely monitoring the repo and broader money markets for signs of changing reserve conditions or potential risks of upward pressure on the federal funds rate. Despite these pressures, the Fed will maintain its plan to reduce the size of its balance sheet (SOMA portfolio runoff) as part of its policy normalization, alongside last week's 50-basis-point rate cut. The Fed also emphasized the importance of a resilient Treasury market for effective monetary policy, reinforcing the work of the Inter-Agency Working Group on Treasury Market Surveillance in supporting this goal.
For now, pressures in the repo market don’t appear to be close to the point where they would start affecting the federal funds rate. For that reason, I believe there is plenty of room to continue shrinking the SOMA portfolio. Still, in 2018, the repo market arguably served as a leading indicator of pressures developing in the reserves market. There is no guarantee that it will be the same again this time, but my colleagues and I will be monitoring its evolution.
So it would seem as though they are ‘aware’ but they were also aware in 2019 that liquidity was gradually tightening. However it underestimated however how quickly reserve scarcity would impact the repo market. Let’s hope that any further developments or liquidity scarcity does not go underestimated this time around.

Get your news from the future.
The Oracle by Polymarket is news with skin in the game. This weekly newsletter gives you insights on global headlines from the world’s largest prediction market, powered by traders around the world with millions of dollars on the line.

Interested in How We Make Our Charts?
Some of the charts in our weekly editions are created using Datawrapper, a tool we use to present data clearly and effectively. It helps us ensure that the visuals you see are accurate and easy to understand. The data for all our published charts is available through Datawrapper and can be accessed upon request.


