A Note From The Team on The Inaugural Edition of the Triumvirate
Bullish Securities has been active on Instagram since 2018, covering topics ranging from the Jeff Bezos divorce to the recent unwinding of the Japanese Yen carry trade. The team is excited to introduce The Triumvirate Research letter, focusing on a new market triumvirate: commodities, currencies and central banks (and no, Julius Caesar isn’t part of this one). Enjoy this first edition, which explores the Japanese Yen carry trade. Upcoming issues will delve into topics such as tracking error in oil funds, central banks' role in the reverse repo market, and the potential introduction of a new BRICS currency. Thank you to everyone who has supported Bullish Securities over the past seven years. We look forward to continuing to deliver quality finance content.

The Japanese Yen Causes Another Market Rout
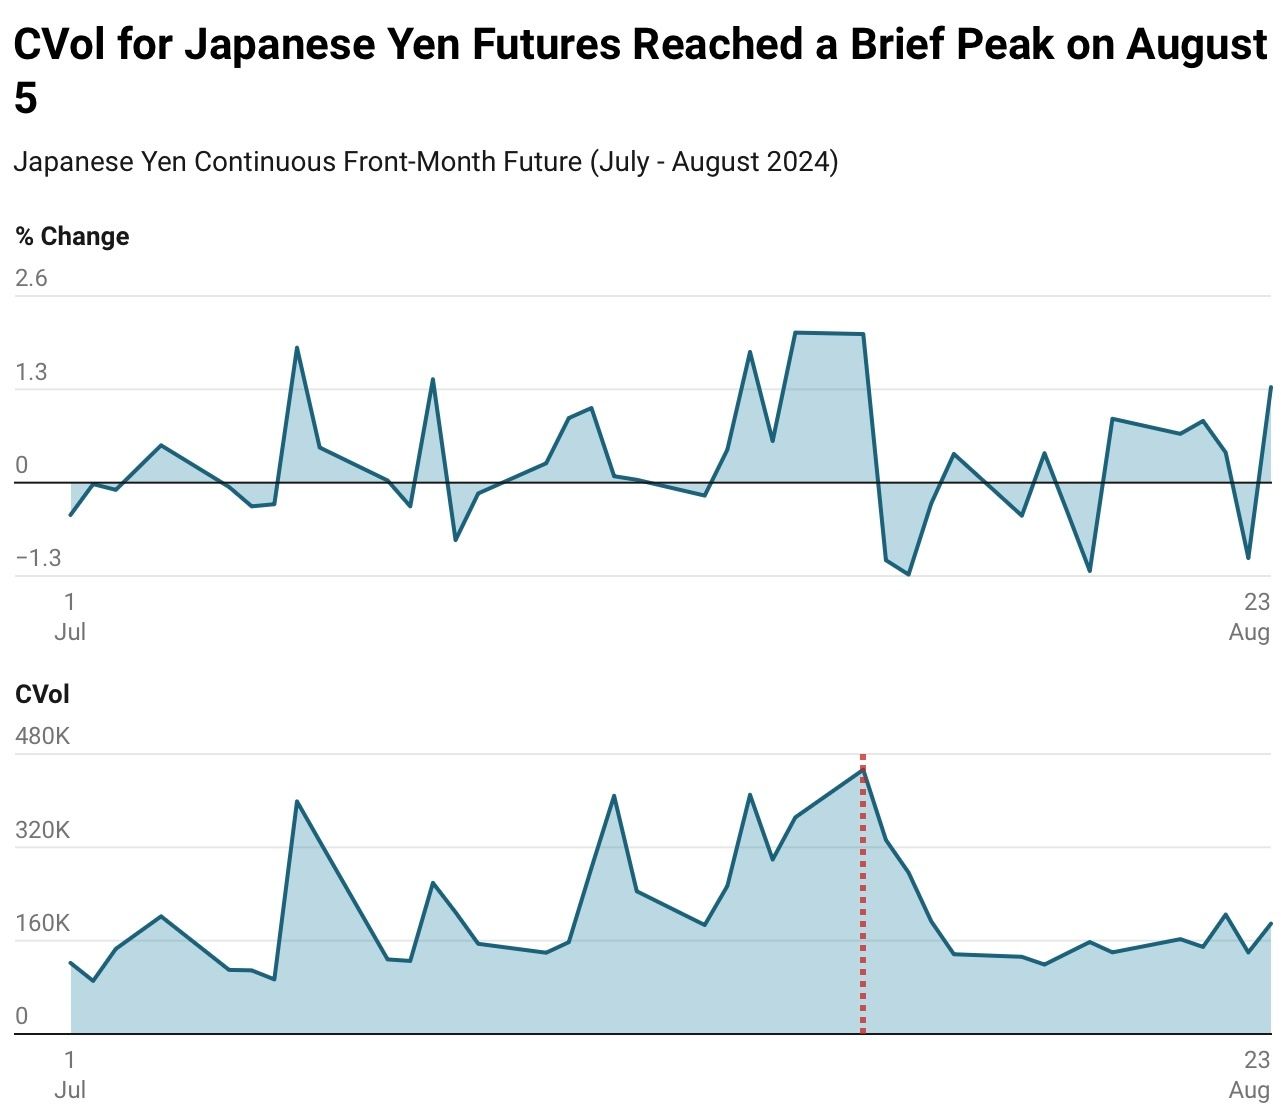
On August 5th, global equities experienced a significant sell-off, initially attributed to concerns about a potential U.S. recession and a tightening labor market, as suggested by the previous week’s weak job report. However, the financial media initially overlooked the real cause of the sell-off and the simultaneous strengthening of the Japanese Yen. Over a trillion dollars in value was temporarily lost due to another episode of the unwinding of the Japanese Yen carry trade, with only 50-60% of the trade expected to be complete, according to JP Morgan reports earlier this month.
The Yen carry trade exploits the failure of the Uncovered Interest Rate Parity (UIP) theory, which dictates that the interest rate differential between two economies should equal the relative change in foreign exchange rates over a specific period. Arbitrage opportunities arise when a currency like the Yen, which has had persistently low interest rates for the past 25-30 years, can be borrowed cheaply. The borrowed currency is then invested in higher-yielding currencies or assets abroad. As long as the Yen (or any other funding currency) remains weak and the interest rate differential remains wide enough, the no-arbitrage principle is violated, allowing for positive returns.
Problems with the trade arise when the currency experiences increased volatility, as observed on August 5th. This can trigger a rapid unwinding of borrowed Yen, leading to a chain reaction of swift appreciation in the currency. CVol has since subsided in the Yen but the path for further tightening by the Bank of Japan remains up in the air.

The Math Behind a Carry Trade
The math behind the trade is relatively straightforward, but it can be influenced by various factors, including foreign exchange movements, central bank policy shifts, and other systemic risks. While relatively simple to enact past instances of unwinding can show how quickly profits can erode from the trade.
Volume Equation
Since the fundamental idea behind a carry trade has not changed since its origin the math presented below is taken from Gagnon & Chaboud (2007) via the Board of Governors of the Federal Reserve System.
Equation (1) defines the profit from the canonical carry trade as equal to the difference between interest earned in foreign currency (iF) minus interest paid in Japanese Yen (iJ) plus the appreciation of foreign currency (e) in terms of Yen, where period t denotes the initiation of the position and period T denotes the closing.
(1) Profit (Carry Trade) = iF - iJ + eT - et
Equation (2) defines the profit from the derivatives carry trade as equal to the difference between the value of foreign currency at closing (eT) and the price paid in the forward contract (f). The strategy involves locking in a future exchange rate through a forward contract and profiting if the actual future spot rate is more favorable than the agreed forward rate.
(2) Profit (Derivative Carry Trade) = eT - f
Equation (3) is the arbitrage condition governing the price of the forward contract in the interbank market (also known as covered interest rate parity). It states that the forward rate should equal the spot exchange rate adjusted by the interest rate differential between the two currencies. If this condition holds, there is no arbitrage opportunity in the forward market.
(3) f = et + iJ - iF
Below is an example of how the carry trade is set up using the formulas provided above. Much of the following sections focus on the Yen/USD trade, which is quite popular today. Before this, the Yen/AUD carry trade was prevalent from 2004 to 2008, as the Australian dollar was a favored target currency due to Australia's relatively high interest rates.
Yen/AUD Carry Trade Example
Initial Parameters
Interest Rate in Australia (AUD), iF : 4.0%
Interest Rate in Japan (JPY), iJ : 0.1%
Initial Spot Exchange Rate (JPY per 1 AUD), et : 90
Final Spot Exchange Rate (JPY per 1 AUD), eT : 92
Forward Rate (JPY per 1 AUD), f : Equation 3
Canonical Carry Trade Profit Calculation (Equation 1)
Profit (Carry Trade) = 4.0% - 0.1% + (92-90) = 5.9%
In this case, the carry trade yields a 5.9% profit over the period, combining the interest rate differential and the favorable movement in the exchange rate.
Forward Rate Calculation Using CIP (Equation 3)
f = 90 + (0.1% - 4.0%) = 90 - 3.9% = 86.49
Here, the forward rate is 86.49 JPY per 1 AUD, which reflects the interest rate differential.
Derivatives Carry Trade Profit Calculation (Equation 2)
Profit (Derivative Carry Trade) = 92 - 86.49 = 5.51 JPY per 1 AUD
In this scenario, the profit from the derivatives carry trade is 5.51 JPY per 1 AUD, or the difference between the actual spot rate at time T and the forward rate agreed upon initially.
The Norwegian central bank provides a solid summary of how purchasing power parity influences the carry trade. One of the earliest studies to test this theory is Fama (1984), where he investigates the validity of UIP using regression analysis, explaining the forward rate relative to the realized future spot rate through the interest rate differential. Empirical literature shows that the average return from the carry trade is both positive and statistically significant. However academics and practitioners are still trying to explain the returns, which is why the carry trade can at times be classified as a market anomaly, similar to the momentum effect (rising prices tend to keep rising, and falling prices tend to continue falling).

Origins: Bank of Japan Monetary Policy
Understanding Japan's 30-year battle with deflation is crucial to grasping the origins of the carry trade and why the country's currency is a primary source of funding for it. The Yen is considered a safe-haven currency, largely due to the Bank of Japan’s implementation of unlimited monetary stimulus under the Yield Curve Control policy in 2016. The central bank committed to pegging the 10-year treasury yield near zero for an extended period. According to a report by the Asian Development Bank, by mid-2016, the Bank of Japan held nearly 40% of all Japanese Government Bonds (JGBs). This massive holding posed a significant challenge in meeting the monetary base target, which necessitated an annual purchase of JGBs of approximately ¥80 trillion or approximately $531 billion. Balancing the dual approach of QE and YCC presented an almost herculean task for the central bank, likened by some as a “put your money where your mouth is” challenge. The BOJ is only now emerging from this ultra-low interest rate environment, having announced its first set of interest rate hikes in 17 years.
Yield Curve Control (YCC) Snapshot
Just as the Federal Reserve utilizes an inflation rate targeting regime the Bank of Japan (BOJ) employed a more unconventional method of monetary policy just under a decade ago. The Japanese monetary authority utilizes yield curve control ensuring long-term yields are pegged within a certain range, in committing to this policy the bank must purchase or sell essentially an unlimited amount of treasuries to ensure rates remain within the ‘pegged’ range. The BOJ implemented YCC in 2016 pegging the 10-year government yield to 0% and short-term rates at -0.1% with an allowance band of 0.50%. The rationale behind this policy shift was Japan’s persistent struggle with muted inflation and slow economic growth, despite years of Quantitative Easing (QE). The program formally ended in March 2024, with the central bank claiming ownership to more than 50% of the JGB market. In 2016 when the program was enacted Japan’s core CPI was 0% compared to the now 2% target that was reached this year, one can claim they perhaps did something right.
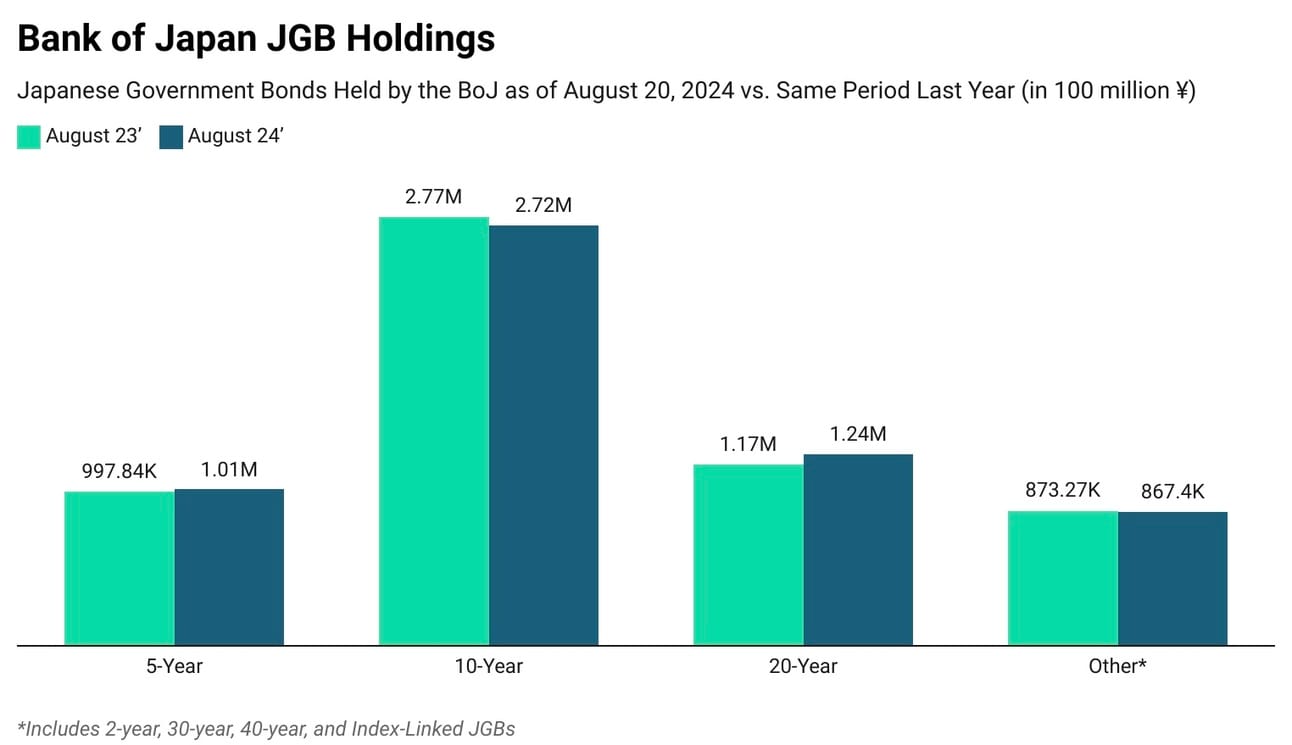
After announcing the abolition of its yield target for Japanese sovereign bonds and scaling back its asset purchase programs, the Bank of Japan has entered its first tightening cycle. Bank of Japan JGB holdings remained relatively stable compared to the same period last year, with 10-year holdings decreasing by ¥50 million possibly in an effort to extend the average maturity of the holdings. Earlier this month BOJ Governor Kazuo Ueda indicated balance sheet normalization is expected to occur over the next two years into 2026.
Is The Trade Still Attractive?
The carry trade was particularly attractive with the Yen on one side because it allows investors to borrow cheaply and move the funds into higher-yielding currencies like the USD or AUD (the AUD/JPY carry trade was notably popular in the 2000s). Now if there is strong forward guidance from one Central Bank to keep rates near zero this ensures carry trade participants the volatility in the Yen remains largely muted unless there is a change in the direction of the policy as seen with the Bank of Japan second rate hike of the year on July 31st to 25 basis points.
Forward Guidance Snapshot: Bank of Japan 1999
Just before the turn of the 21st century, the Bank of Japan faced a significant challenge to its credibility with its forward guidance. In 1999, the BOJ adopted a Zero Interest Rate Policy (ZIRP) in an effort to stimulate economic activity. Although deflation in the 1990s was mitigated to some extent by consistent public investment, the efficacy of the loose monetary policy was questioned. A 1999 working paper from the BOJ’s Research and Statistics Department noted that the ‘positive effects’ of the 1990s monetary easing were diminished by the deterioration of borrowers' balance sheets, contributing to the prolonged stagnation of the Japanese economy during that period.
When Masaru Hayami became BOJ governor, he was tasked with revitalizing the Japanese economy. He initially used forward guidance, one of the oldest tools in monetary policy. At that time, rates had already been reduced to near zero (0.50%). Despite the guidance being informal, it served as a communication strategy aimed at providing additional monetary easing by committing to a longer period of zero interest rates than the public and markets expected. However, forward guidance has several issues:
1. It is extremely vague which can be left to open interpretation by public markets. It may be more cost effective then committing to other lower bound policies but sure to be less effective.
2. Is it in line with other board members? According to the monetary consensus in 1999 while the board consensus was fairly low on the CPI side ranging from [-1,-0.5] YOY % change it did not necessarily mean that all board members agreed on lower rates for longer, informal guidance or not.
3. Finally the market is fickle and has an extremely short memory, this seemed like a temporary fix to cool expectations but as we know the BOJ would have to back away from the ZIRP not long after.
The rate increase cycle was to be expected this year after earlier signs of stable inflation in June. Nevertheless in the short-term the policy gap between the BOJ and Fed remains wide in the short-term. Japan's policy rate is 0.25% after two hikes this year. The U.S. federal funds rate is at a 23-year high of 5.25% to 5.5% with expectations of a 25 basis points cut in September.
On the price front, the year-on-year rate of increase in the consumer price index (CPI, all items less fresh food) has been in the range of 2.0-2.5 percent recently, as services prices have continued to rise moderately, reflecting factors such as wage increases, although the effects of a pass-through to consumer prices of cost increases led by the past rise in import prices have waned. Inflation expectations have risen moderately.
Converging With Fed Policy
The USD has suffered four consecutive weeks of losses against major foreign currencies. Expectations are growing that the Federal Reserve will implement the first rate cut of this cycle at their September meeting. The downward revisions in the March jobs report (-818,000) have also pushed the CME Fed Watch Tool’s probability of a 50 basis points cut to 32.5% at the time of writing. Meanwhile, the Yen has climbed over 2.8% against the USD this month and shows no signs of stopping. The loose policy has given way to an astronomical amount of cross border Yen borrowing - amounting to $742 billion since the end of 2021 according to the Bank of International Settlements.
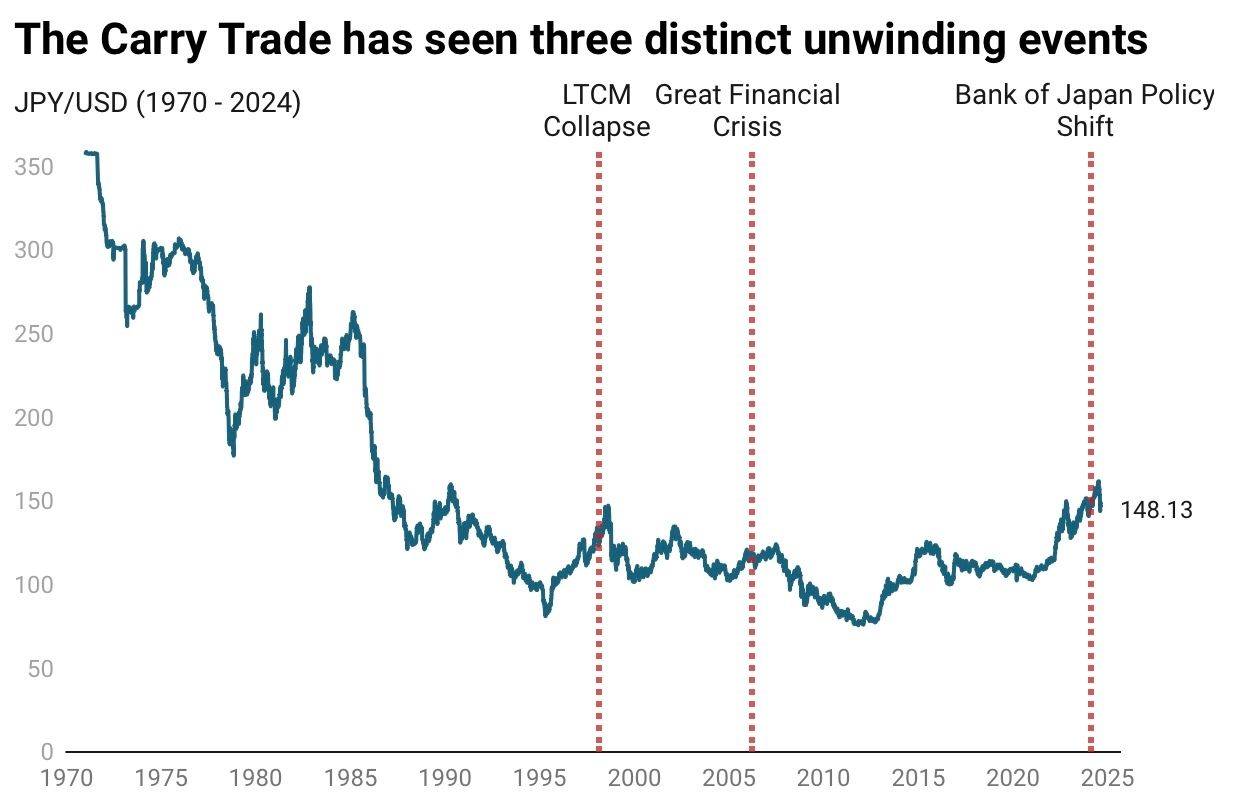
To provide a more clear picture of the future of the JPY carry trade we can look to past instances of the global unwinding which brings us to the Long-Term Capital Management Collapse that occurred in 1998.

Past Instances of the Carry Trade Unwinding
It would be naive to assume that the carry trade can be unwound solely by changes in the policy rate or a free-floating exchange rate. Given its popularity and potential crowding, any adverse movements in treasuries, equities, or other tradable assets could prompt investors to liquidate their positions and return their borrowed Yen, leading to a sharp appreciation in the funding currency and a simultaneous depreciation in the foreign currency.
Long-Term Capital Management (LTCM) Collapse (1998)
LTCM, the now-defunct hedge fund, was founded in 1994 by John Meriwether, the former vice-chairman and head of bond trading at Salomon Brothers. Members of LTCM’s board of directors included Myron Scholes and Robert C. Merton, who, in 1997, shared the Nobel Prize in Economics for their development of the Black–Scholes model the underpinning of all modern-day option pricing. While the hedge fund’s performance and ultimate collapse could fill an entire book (and indeed it has: When Genius Failed), the key focus here is its connection to the Japanese Yen carry trade.
In 1995, the U.S. entered into the Reverse Plaza Accord (the original Plaza Accord was in 1985) to raise the value of the U.S. dollar and reduce the value of the Japanese Yen. Over the next 18 months, the U.S. dollar rose by 50%, which also lifted other foreign currencies pegged to the dollar, including the Russian ruble and various Asian currencies. According to the CFA Institute this rapid appreciation of the dollar in the mid-1990s forced many Asian economies, which held significant U.S. dollar-denominated debt, to either devalue their currencies or face much larger debt repayments. This situation contributed to the Asian Financial Crisis in 1997 and intensified competition from LTCM counterparts, reducing arbitrage opportunities for the fund forcing them to explore opportunities in credit and currencies in emerging markets.
Around the time of LTCM’s collapse in 1998, the Yen appreciated by 20% from its lows, a period marked by a reduction in prime brokerage funding due to the LTCM crisis. The hedge fund was eventually bailed out by a consortium of banks, primarily because of its substantial holdings in Russian sovereign debt during the ruble’s major devaluation and Russia’s subsequent default, which surprised the market at the time. At its peak, LTCM held an estimated 5% of the global fixed income market.
In the first two weeks after the bailout, LTCM continued to lose value, particularly on its dollar/Yen trades, with press reports estimating the loss at $200 million to $300 million. According to Dowd et al. (2008), the firm’s losses in August 1998 amounted to $1.7 billion—at the time it was considered an 8.3 standard deviation event. This suggests that such a loss would only occur once every 6.4 trillion years.
Great Financial Crisis (2006-2008)
Fast forward 8 years during the early stages of the financial crisis in 2006, the Yen began appreciating rapidly as traders unwound their positions. From 2007 to 2008, the Yen rose over 30% against the U.S. dollar. Although there is no official data on the scale of the Yen carry trade in 2008, reports suggest it was in the hundreds of billions of dollars. As investors fled to safe-haven assets, the Yen strengthened to 87.13 per dollar by December 2008.
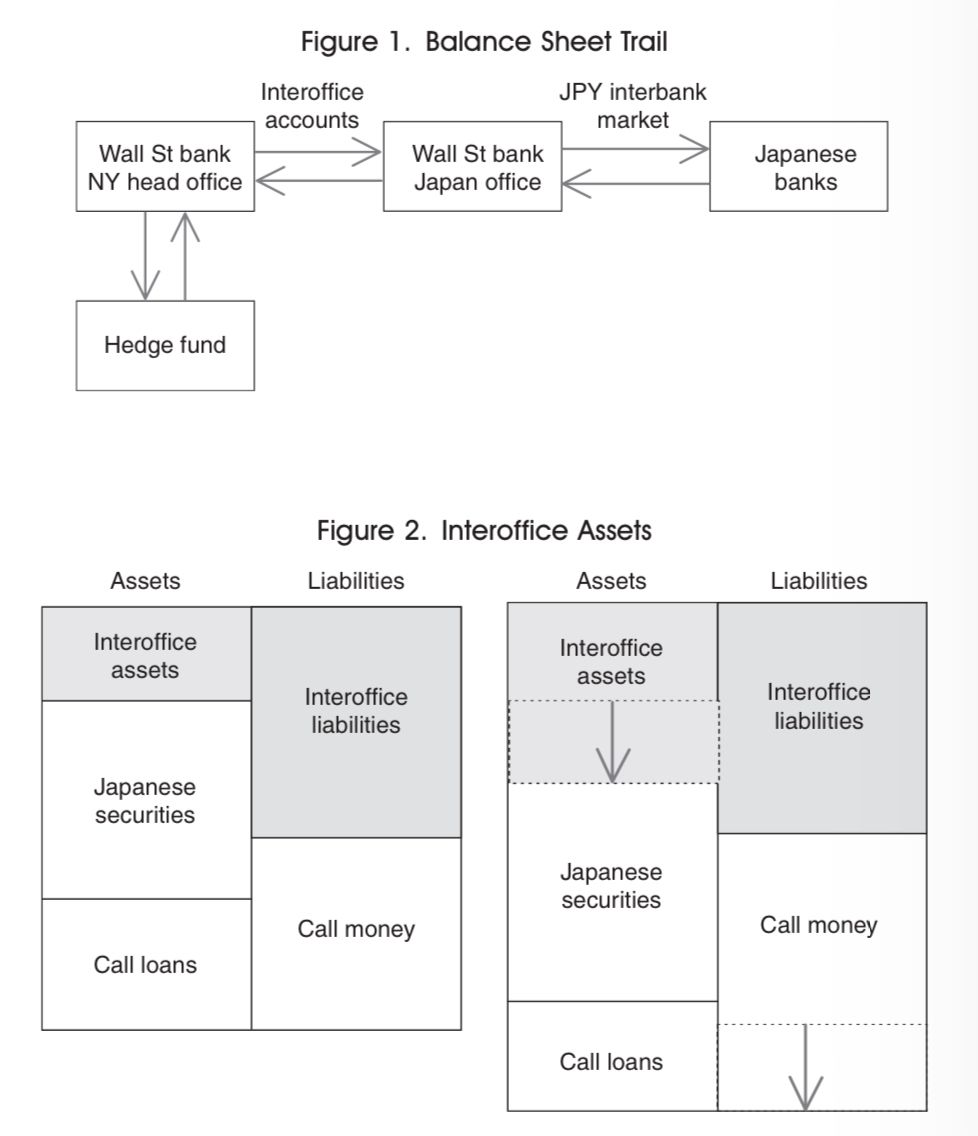
While it may seem purely driven by foreign exchange transactions, a 2009 IMF paper proposes that during the subprime crisis, the amount of Yen funding channeled outside of Japan was mirrored by fluctuations in the size of U.S. broker-dealer balance sheets.
The figures above and the subsequent analysis of the unwinding of the carry trade illustrate two sides of the same coin. In Figure 1, a hedge fund is shown funding a trade through a prime brokerage, represented by an investment bank’s New York office. The prime brokerage then finances the hedge fund’s position through its Japan office, which in turn borrows from the JPY interbank market. Given a decade marked by 25 to 30 turns of leverage and a rapidly expanding mortgage-backed securities (MBS) market, the inevitable unwinding of the carry trade and the subsequent decline of the U.S. dollar were closely interconnected.
Bank of Japan Policy Shift (2024)
The Bank of Japan’s policy decisions on July 31st signaled key developments that led to a sharp unwinding of the Yen carry trade on August 5th:
Interest Rate Hike: The BOJ raised its interest rate to 25 basis points, marking the second hike this year. The BOJ governor’s language suggested that further hikes, potentially up to 50 basis points, were not off the table.
Tapering Bond Purchases: The BOJ announced plans to reduce its monthly bond purchases to around ¥3 trillion ($19.9 billion) by the first quarter of 2026, a significant decrease from the recent pace of purchases, which has been double that amount, according to Bloomberg.
Following the announcement, the Yen strengthened by more than 1.5% against the dollar. The yield on 10-year Japanese government bonds rose 6 basis points to 1.055%, and yields on two-year notes reached a 15-year high. The normalization of the central bank’s balance sheet will take time, as the ¥760 trillion holdings are nearly five times the size they were in 2013 when the ultra-loose monetary policy began.
Expectations of tighter policy are contributing to a narrowing gap with U.S. interest rates, which are anticipated to decrease following the September Federal Reserve meeting. While the Yen suffered a 12% drop against the dollar in the first half of the year, the rise in the Yen in early August has subsided and remains less volatile heading into the fall.

Cross-Border Yen Holdings Post COVID
The carry trade is inherently a cross-border activity since it involves two different currencies. With the Japanese Yen being relatively cheap, the flow of Yen outside Japan's borders is more intriguing to analyze than domestic holdings. The Bank of Japan has been compiling the Flow of Funds Accounts Statistics (the FFA) since 1958, covering the data from 1954. The Bank has started releasing data on Debt Securities since September 2015.
Borrowing by Banks
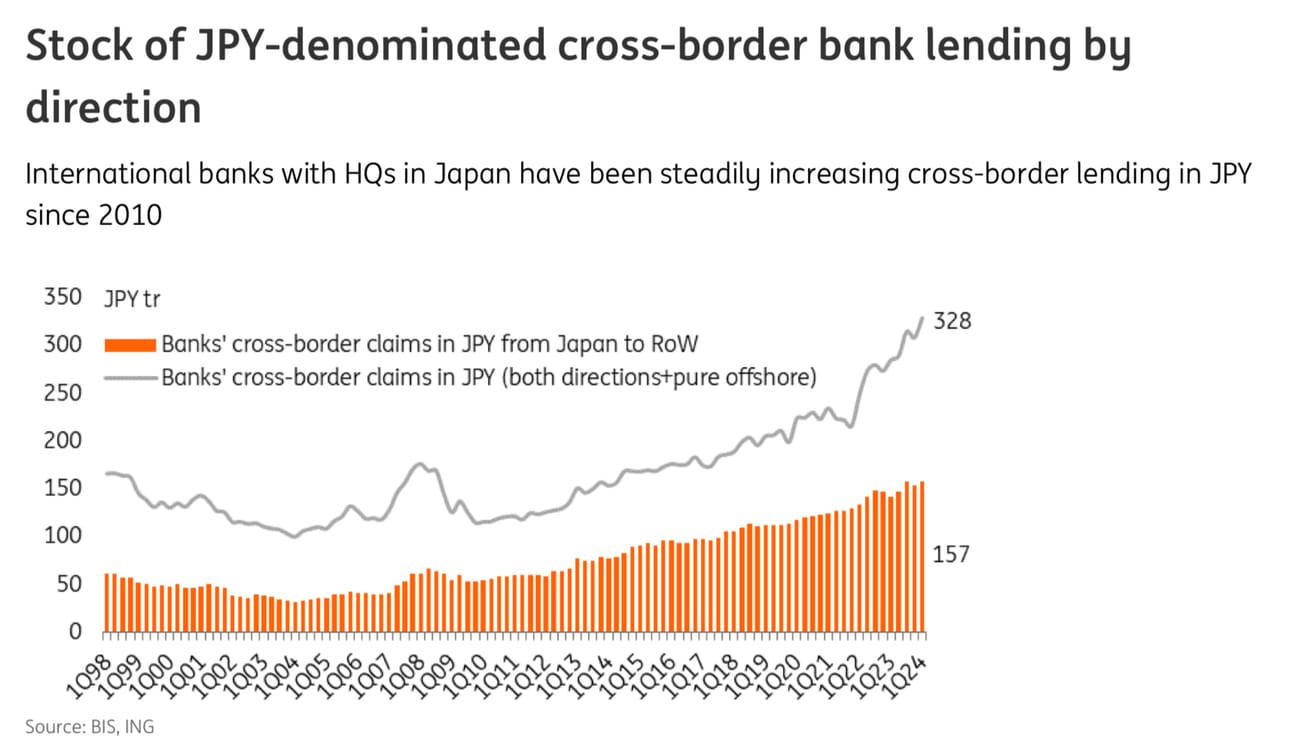
An early August ING Think report cited cross-border Yen borrowing by banks had increases substantially since 2021. The report highlights the flow of Yen in and outside of Japan. As of March 2024, cross-border loans originating in Japan stand at ¥157 trillion (equivalent to U.S. $1 trillion), reflecting a 21% growth compared to 2021 (an increase of US$181 billion, net of FX revaluation effects).
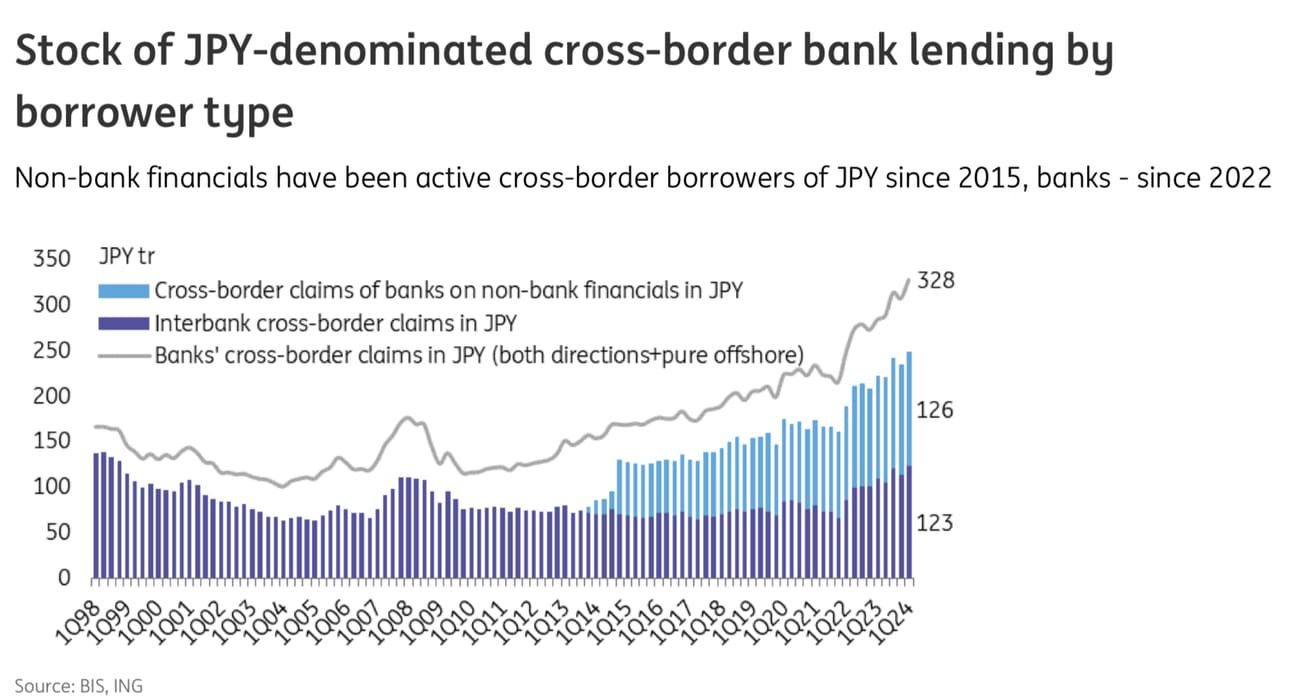
Cross-border Yen borrowing by banks totaled around ¥330 trillion ($2.3 trillion) as of end-March 2024, up 52% from 2021. The recent pickup in cross-border Yen borrowing appears to be led by interbank lending, which nearly doubled from ¥67 trillion at the end of 2021 to ¥123 trillion in March 2024.
The substantial increase in Yen interbank borrowing since 2021 is not surprising, but the key data to watch will emerge in the coming months, especially as other funding currencies potentially become more attractive and the Bank of Japan tightens its policy further. The 52% increase in interbank lending likely contributed to the sudden unwinding on August 5th, which saw Japan’s TOPIX index drop by over 12% in a single day—the largest drawdown since the 1987 Black Monday crash—while major indices in North America and Europe fell by 2-3%.
Further Evidence from the Bank of Japan Flow of Funds Data
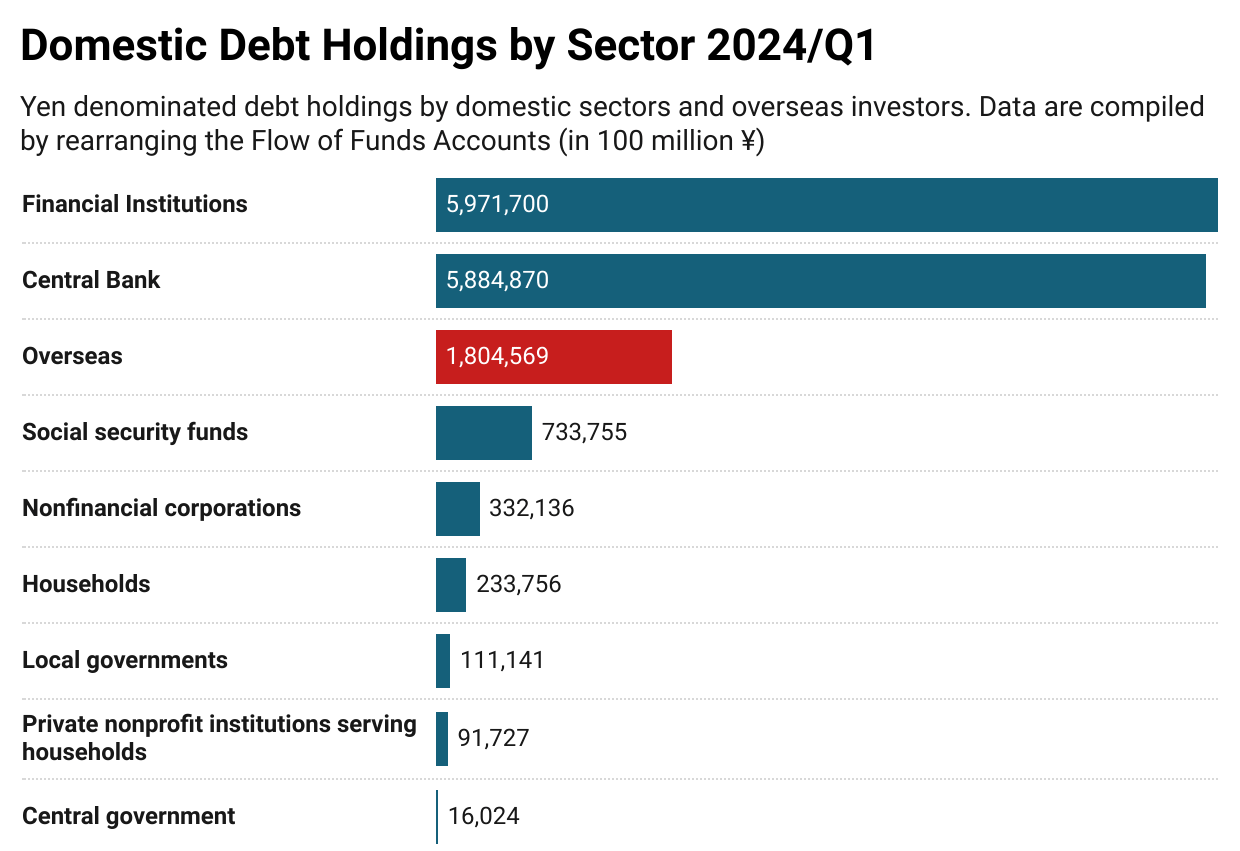
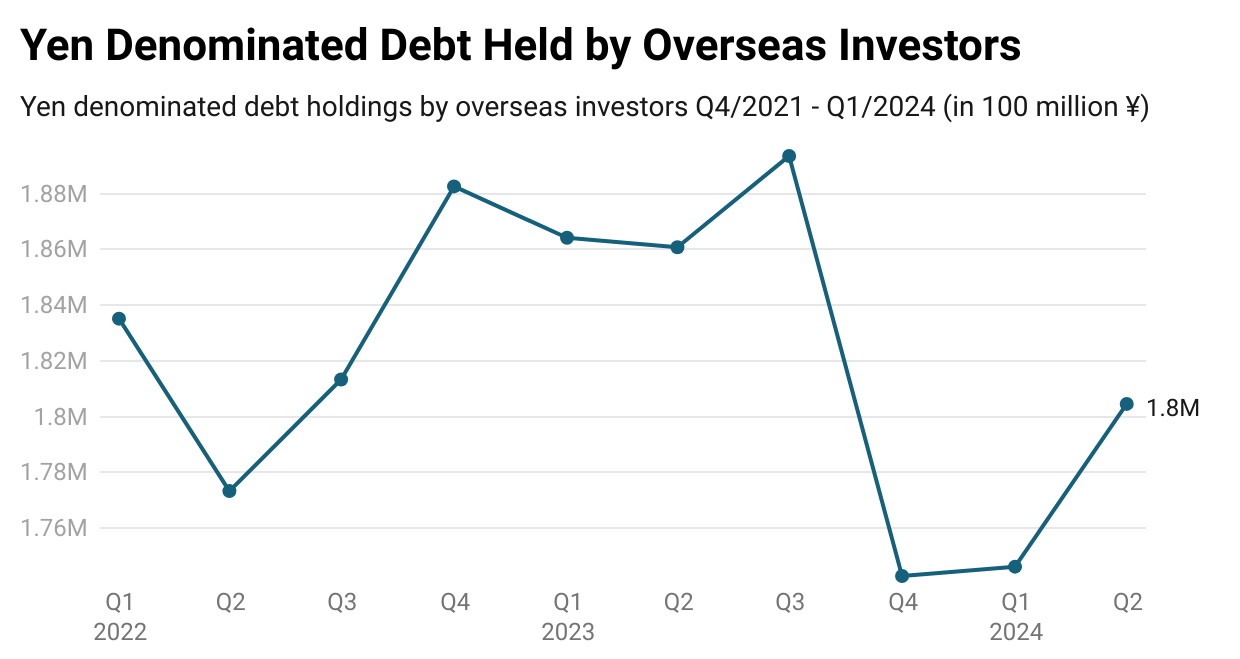
According to the latest Bank of Japan Flow of Funds data, overseas holdings of domestic debt securities (borrowed Yen) make up just over 11% of Japan's total outstanding debt. As of Q1 2024, these holdings amount to ¥180 trillion, marking a 3% increase from the previous quarter. This increase may be linked to higher funding for the global carry trade. While cross-border borrowing among banks remains strong, overall overseas borrowing has been stagnant in recent quarters. The decline observed into late 2023 may reflect the impact of the Bank of Japan’s hawkish policy shift, which became evident in Q1 2024.

What Comes Next?
The question that remains floating amongst practitioners and policymakers alike is what comes next? With a converging policy between two of the most prolific central banks where does that leave the Yen in being the primary funding currency of the carry trade. Nikkei Asia’s August 26th report on the volatility of the Yen provides some structure for what we might see in the short-term.
"If volatility settles back down, it seems likely that the Yen carry trade will make a comeback," said Yoshitaka Suda, a quant analyst at Nomura Securities.
One metric to watch is the three-month implied volatility of the Yen, he said.
The figure stood at 11.6% to 12% on Monday, according to Refinitiv. Suda predicts Yen carry trades will start increasing if the figure falls below 10%. He expects macro funds to jump back into Yen carry trades if the figure drops below 9%, a level seen in mid-July when Yen shorts reached a peak.

Pictured at the Jackson Hole Symposium in August, from left to right: Christine Lagarde (President of the ECB), Kazuo Ueda (Governor of the Bank of Japan), and Jerome Powell (Chairman of the Federal Reserve).
While volatility has subsided, the next FOMC rate decision is scheduled for September 17, which could provide insight into the Fed’s policy direction for the new easing cycle. A May report from Goldman Sachs suggests that the BOJ is unlikely to cite yen weakness as the primary reason for raising the policy rate, although potential hikes in October could increase pressure on the trade. Additionally, RBC notes the emergence of a Yuan carry trade, as the PBOC is expected to maintain a dovish policy in the coming months. However, the trade faces challenges due to the yuan’s non-convertibility, as authorities control its inflows and outflows, making it difficult to size the trade accurately.

Interested in How We Make Our Charts?
Some of the charts in our weekly editions are created using Datawrapper, a tool we use to present data clearly and effectively. It helps us ensure that the visuals you see are accurate and easy to understand. The data for all our published charts is available through Datawrapper and can be accessed upon request.

