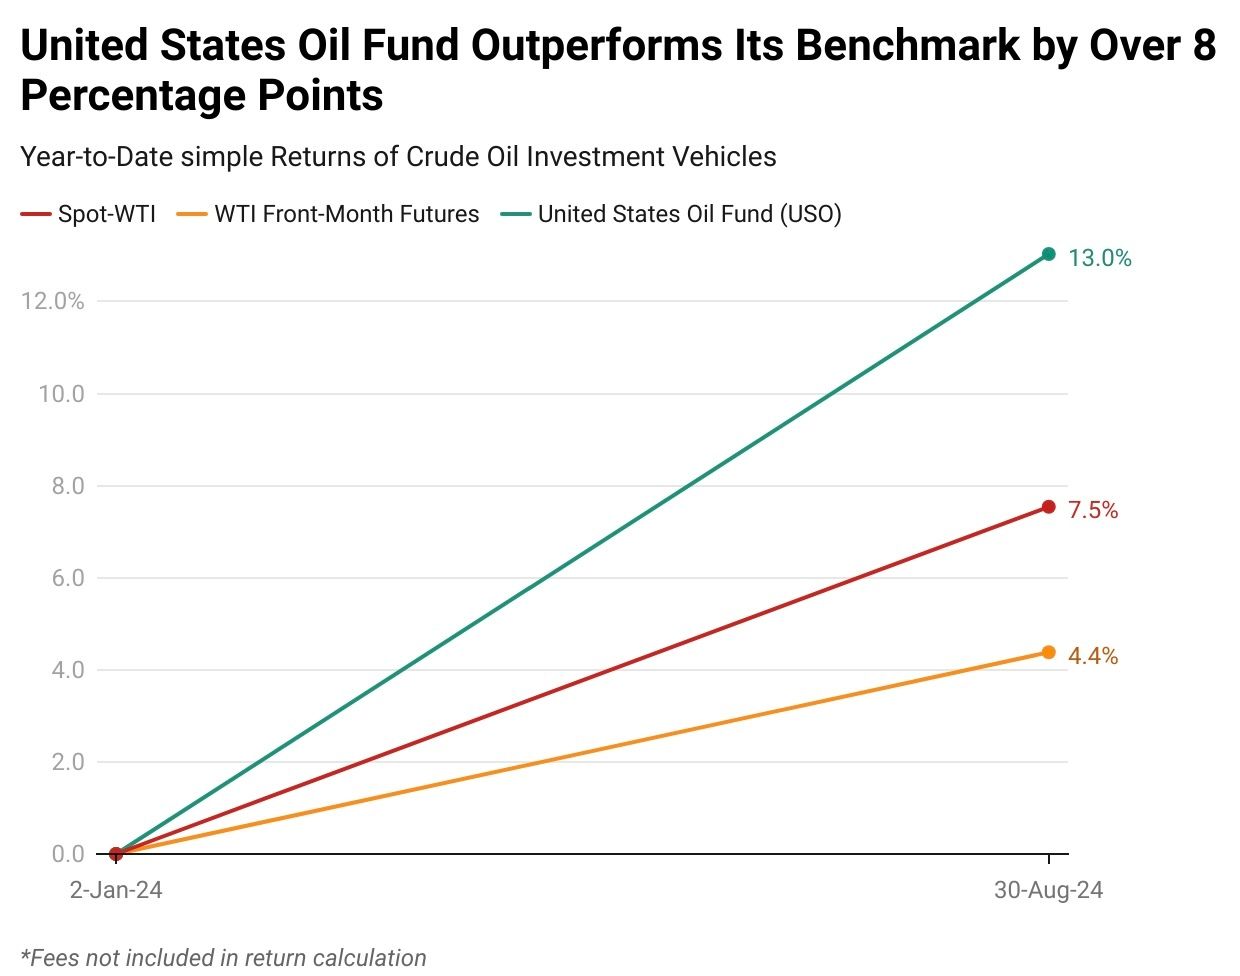
Not All Returns are Alike
Source: FactSet
The wide spreads illustrated in the graphic above can be attributed to several factors. While there are various ways to gain portfolio exposure to crude oil, the returns from these investment vehicles can diverge significantly over the long term. Each product, whether it’s an ETF, mutual fund, or direct investment in futures, is subject to different management strategies, fees, and underlying asset compositions, all of which contribute to the variance in returns. The sections below explore tracking error in crude oil investments.

Overview of Crude Oil Investment Vehicles
Before examining the challenges in tracking spot oil, it’s important to first define the ways in which market participants can gain exposure to crude oil in a portfolio. A brief overview of each vehicle is explained below.
Derivatives (Paper)
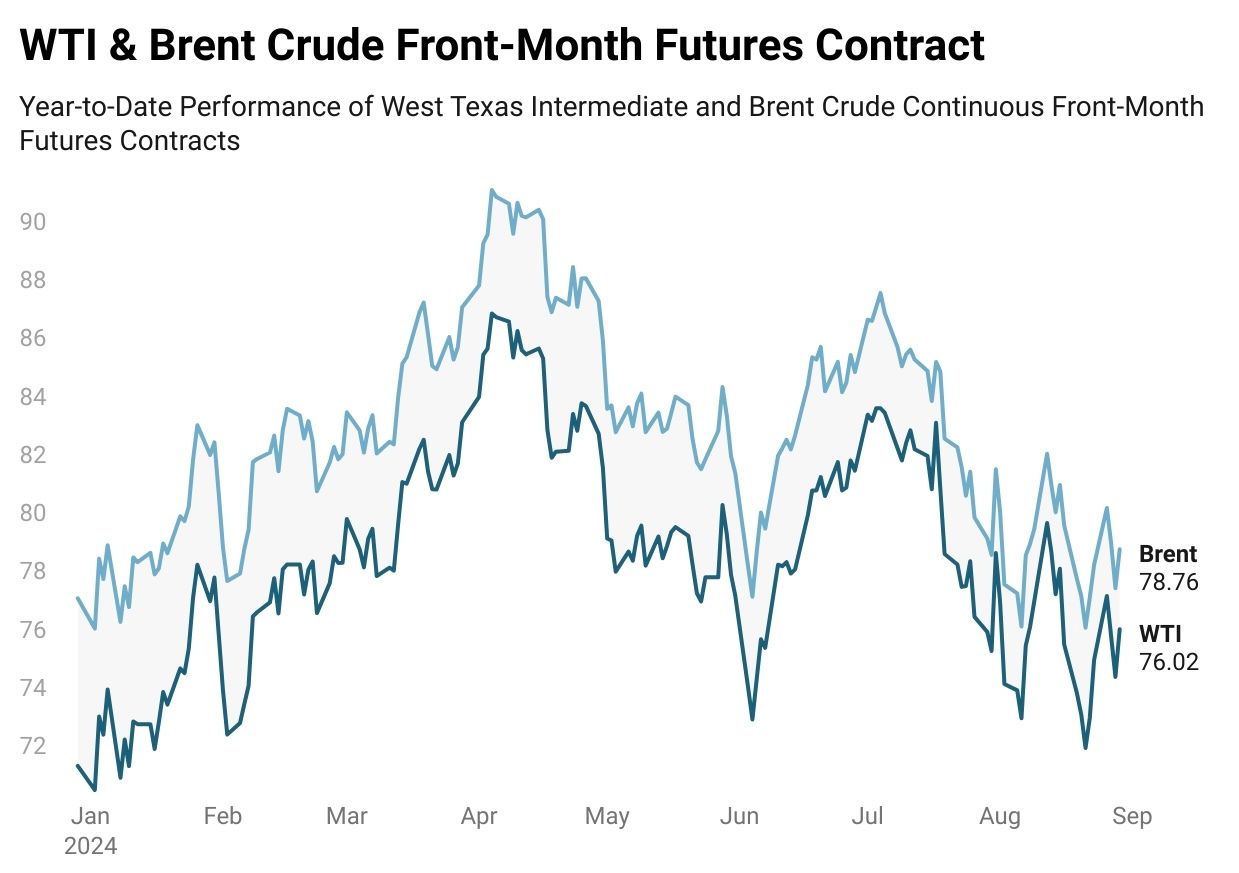
The most common way to gain exposure to crude oil is through futures contracts. While there are many other derivatives available for exposure or hedging in oil markets, the futures curve remains the most widely used instrument. The two major global oil benchmarks tracked by futures are West Texas Intermediate (WTI) and Brent Crude Oil.
WTI futures and options are primarily traded on the NYMEX, accounting for 80% of the volume on the exchange (Scheitrum et al., 2018). WTI, a key benchmark for West Texas oil, sees over 1 million contracts traded daily, with approximately 4 million contracts of open interest, according to CME. WTI provides a reference point for American oil that is transported globally and represents the most liquid market for U.S. benchmark oil.
Brent Crude, the competing benchmark for global oil pricing, is traded on the Intercontinental Exchange (ICE), where 90% of its volume originates. Brent Crude specifies delivery to a vessel at the Sullom Voe oil terminal on the Shetland Islands in the North Sea (Scheitrum et al., 2018). The benchmark is primarily used for pricing oil that originate outside the U.S., a study by ICE found that 78% of globally traded oil is priced off of the Brent Benchmark either directly or indirectly according to data compiled by Energy Intelligence.
Source: FactSet
Exchange Traded Products (ETPs) & Mutual Funds
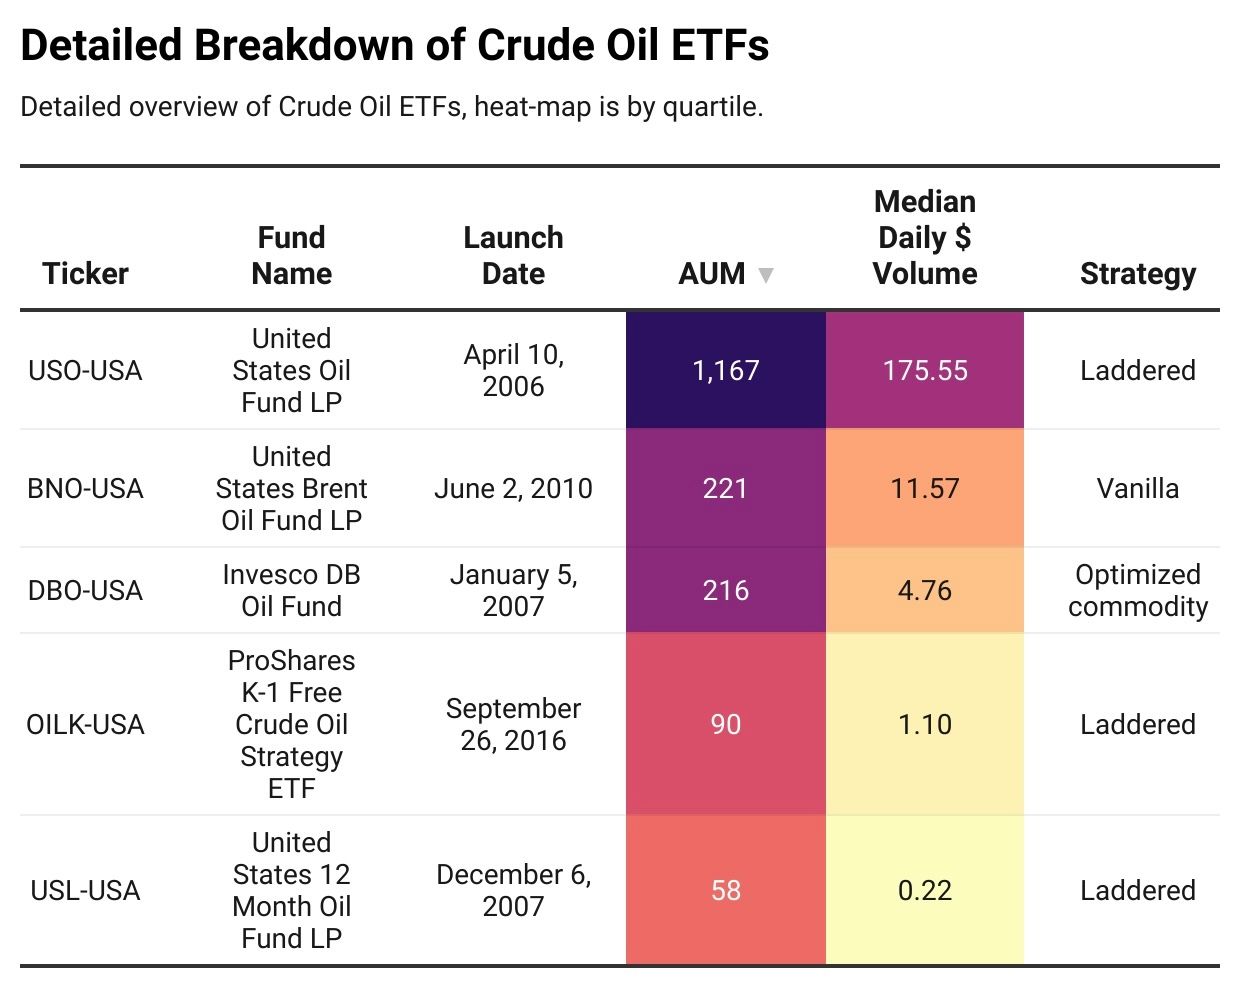
Exchange traded products can act as a simple low-cost choice to obtaining exposure to crude oil. The most actively traded oil ETF is the United States Oil Fund or USO issued by the United States Commodity Fund. The United States Oil Fund is an ETF designed to track the daily price movements of West Texas Intermediate (WTI) crude oil. It provides exposure to oil prices without having to directly trade in the futures market. The fund invests in WTI front-month futures (nearest expiry). At the end of each month the fund rolls the futures contract into the next month (September expiration will become October for example). The process is known as rolling and is done a few days prior to the contract coming up for delivery.
According to firm reports the objective is to ensure that the daily percentage change in USO’s net asset value (NAV) over any 30 consecutive valuation days is within ±10% of the average daily percentage change in the price of the Benchmark Oil Futures contract over the same period. More discussion on why there may be deviations in the NAV is presented in the “Tracking Error” Section. The fund along with a Brent variation (United States Brent Oil Fund) are widely traded and highly liquid with average daily volume (AVD) of 2,610,147 shares. There also exists ETFs and ETNs that provide exposure to a basket of energy equities, the largest of which is the Energy elect SPDR ETF (XLE) with holdings in 22 major U.S. oil firms that are constituents of the S&P 500.
Source: FactSet
Equities
Equities can also provide more focused exposure to the commodity, though they come with elevated idiosyncratic risk. Investors can target a broad spectrum of sub-sectors, including firms involved in oil exploration, drilling, transportation, trading, and other related activities. The largest oil firms sorted by market capitalization (in dollars) are outlined below.

Source: Companiesmarketcap.com

Tracking Error
What is it?
Tracking error refers to the difference in returns between an investment vehicle and its underlying benchmark. For instance, the tracking error for the USO ETF would be the difference between the return of the USO ETF and the return of the front-month WTI futures contract, which the ETF aims to track. Tracking error can result from factors such as transaction costs, liquidity, cash drag, and rebalancing. It is typically measured as the standard deviation of the excess returns over time, with "excess" referring to the difference between the investment vehicle's return and that of the benchmark it aims to replicate.
Tracking Error = SQRT ( ∑ (Rv - Rb)2 × (1/N-1))
Where
Rv = the return of the investment vehicle
Rb = the return of the benchmark
N = number of return periods
In a recent study on the challenges of oil investing, Chincarini and Moneta (2021) examine the returns of oil investment vehicles from 2009 to February 2017. They find that the total returns for the USO and OIL exchange-traded products were −67.71% and −73.36%, respectively, compared to a 20.72% return for spot oil. Exchange-traded products that invested in oil companies exhibited lower tracking errors over the period, with XLE and VDE achieving total returns of 46.16% and 42.44%, respectively. However, the tracking error remained significant, averaging 29% on an annualized basis for products tracking a basket of oil companies. The study highlights the difficulty in tracking spot oil and the large deviations observed in related products. This issue became more evident during the oil market demand shock at the onset of the COVID-19 pandemic.
Select Evidence from COVID-19 Oil Shock
We don’t have to look far to obtain recent evidence of tracking error in the crude oil market. April 20th, 2020 marked a historic moment for U.S. oil benchmark West Texas Intermediate (WTI) that saw the front month contract price decrease from $18 to approximately $-37 per barrel. Similarly, Brent Crude, a global benchmark for oil, saw its futures contract decline to $9.21 on April 21st, constituting an 86 percent decrease from the beginning of 2020. This price action underscored the severity of the exogenous demand shock that reverberated throughout the energy sector. An exogenous shock such as turning off the taps during the COVID-19 pandemic can be a catalyst for a wider tracking error between spot oil and investment vehicles that attempt to track it.
A paper published in Energy Economics last year observed a connection between heightened oil price volatility and reported COVID-19 deaths. Using U.S. data from January 2, 2020, to December 31, 2021, the study found that when the daily COVID-19 death toll exceeded a threshold of approximately 2,100, higher death counts significantly reduced oil price returns. Additionally, oil price returns became more sensitive to common systematic risk factors under these conditions.
Considerations in the Oil Market
Tracking spot oil prices presents unique challenges, especially given that global oil production is largely influenced by OPEC+ decisions. Factors such as the shape of the futures curve (contango vs. backwardation), roll yield, and storage costs further complicate the process. Since directly investing in spot oil is impractical, investors typically turn to futures contracts of major oil benchmarks. However, the returns from these futures differ from those of spot oil. If an investor did attempt to invest in spot oil, they would face significant storage costs, ranging from $0.20 to $1.20 per barrel per month (Chincarini & Moneta, 2021). Properly accounting for these storage costs can reduce the tracking error of near-term crude oil futures, though some discrepancies remain.
Contango, Backwardation and the Roll Yield
In a contango environment, where the futures price is higher than the spot price, tracking error can increase as the fund must continuously roll into more expensive contracts each month, causing deviations from the spot price. In contrast, backwardation, where spot prices are higher than futures prices, typically results in a higher convenience yield and a positive roll yield, reducing tracking error. When a fund rolls over its futures contracts in backwardation, it buys new contracts at a lower price than it sells expiring ones, creating a positive roll yield that boosts returns and reduces the divergence from the spot price.
Roll Yield In Contango
The roll yield is typically negative because the investor must buy higher-priced contracts after selling lower-priced ones, resulting in a loss. This is a key reason why funds tracking oil prices through futures underperform the spot market during prolonged periods of contango.
Roll Yield In Backwardation
The roll yield is positive, as the investor sells higher-priced contracts and buys lower-priced ones. This enhances returns, allowing futures-based funds to potentially outperform the spot price.
Ilya Bouchouev’s Virtual Barrels provides an in depth theoretical discussion on the oil own rate of interest or convenience yield as well as its primary components.
Neither convenience yield nor storage costs are directly observable in the oil market. What one can infer from the futures curve is only their combined effect, which is the own rate. Nevertheless, such a theoretical decomposition is still useful for understanding that the own rate is driven by the tug of war between the intrinsic value of the commodity and the cost to store it. The own rate of interest is one of the most important drivers of many trading strategies. Futures traders though give it a different name, the roll yield.
Convenience Yield Snapshot
The convenience yield represents the benefit of holding the physical commodity over a futures contract. It reflects the advantage of having immediate access to the commodity, as opposed to waiting for future delivery. While not directly observable in the market, the convenience yield can be inferred from the shape of the futures curve, with higher yields typically implied when the market is in backwardation and lower yields in contango. This balancing term was coined as convenience yield by Nicolas Kaldor in 1939, which he interpreted as a negative component of the storage cost. The relationship between futures and spot prices is then determined by the relative magnitude of the total carrying costs and the commodity convenience yield.
Below is an example of how tracking error manifests in the oil market with a contango futures curve through a negative roll yield.
Example: WTI Futures Contango and Tracking Error
On September 21, 2015, the following prices were observed:
Spot price: $46.67
Front-month futures (expiring tomorrow): $46.68
Next-month futures: $46.96
However, the next-month contract is priced higher, at $46.96. This means that after selling the front-month contract at $46.68, the investor must now buy a new contract at $46.96, resulting in a $0.28 loss per barrel simply from rolling the position.
Even if the price of oil stays constant and does not change from day to day, the investor faces this roll cost due to contango. Over time, these small losses accumulate, leading to a situation where the performance of the futures investment lags behind the spot price.
In this case, the investor experiences a loss of 1 cent ($0.01) per barrel (difference between spot price $46.67 and futures price $46.68) in just one day. This equates to a daily loss of 0.022%, which, when annualized, becomes approximately 5.43%. This means that over a year, independent of any changes in oil prices, the investor could expect to underperform the spot oil index by about 5% purely due to the cost of rolling futures contracts in a contango market.
Storage Costs
The cost of storing crude oil is a significant factor that influences oil prices and the basis (difference between spot and futures prices):
Storage costs correspond to about 0.50% of the spot price of oil on average, but can fluctuate considerably, exhibiting a monthly volatility of 0.89% according to a recent study from the University of Essex.
Storage costs are higher during contango periods (0.74% on average) when there is a strong incentive to store oil, compared to backwardation periods (0.13%) when the incentive is low (due to spot price being higher than the nearest futures contract).
Variations in storage costs can dominate the level of the oil futures-spot basis and account for nearly half of its variations, challenging assumptions that storage costs are small or constant.

The Market Today
While tracking error is fairly common geopolitical risks and supply or demand shocks can cause the deviation to widen in the short-term as examined during COVID-19. Several recent developments could contribute to the tracking error observed in oil markets.
OPEC+ Halts Production Hikes Until December
Earlier this week, Bloomberg reported that OPEC+ decided to extend its production cut of 2.2 million barrels per day to begin in December 2024, aiming to maintain market balance and support declining prices. Brent crude for November delivery has dropped from a recent peak of $97.69 to $73.23 at the time of writing. In addition to this extension, OPEC+ took similar measures in June, lengthening the production cut through the end of September to mitigate market volatility. On Wednesday, WTI fell below $70 per barrel for the first time in nine months. In the short term, OPEC+ appears committed to production cuts to stabilize prices.
Oilprice.com reported that the U.S. Energy Information Administration (EIA) model projects an inventory draw of 0.5 million barrels per day, while the International Energy Agency (IEA) model forecasts a draw of 0.5-0.7 million barrels per day. Although these draws are not substantial, they represent a significant year-over-year improvement compared to the builds recorded in Q4 2023. The relative improvement is estimated at 1.4 million barrels per day in StanChart’s model and 1.3 million barrels per day in the EIA’s model.
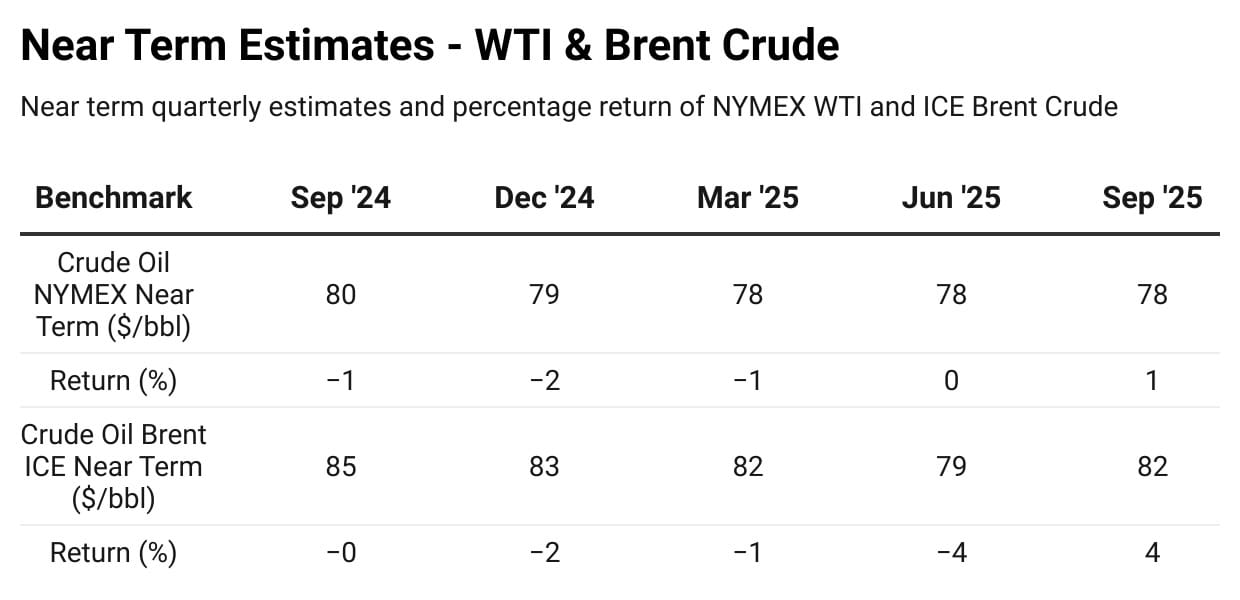
Source: FactSet Estimates
The Libya Situation
Libya recently halted oil production due to the ongoing power struggle between rival factions in the East and West as well as the Libyan Central Bank who controls the nation’s oil revenues. The country is a key supplier of European crude and the halt could cause disruptions in the short-term if a plan is not laid out to replace the central bank governor who the Eastern factions insist on having reinstated.
The Central Bank of Libya is the sole manager of the country’s hydrocarbon revenues, making it a crucial institution for economic control. Libya’s economy is heavily reliant on oil, with the hydrocarbon sector accounting for over 60% of GDP and 90% of both fiscal revenues and exports. By controlling oil revenues, the central bank wields significant influence over Libya’s finances according to EnergyNews.
Key Points Regarding the Situation
Libya's eastern government stopped all oil production and exports on Monday as it vied for control against the Tripoli-based government.
The shutdown has cut Libya's oil production by over 700,000 barrels per day, more than halving its output from 1.2 million bpd. The country accounts for about 1% of global oil production according to Reuters.
The UN is mediating talks to resolve the crisis. On Wednesday, the two sides reached an initial agreement to appoint a new central bank governor within 30 days.
A few oil shipments have been authorized from storage, but exports remain mostly blocked.
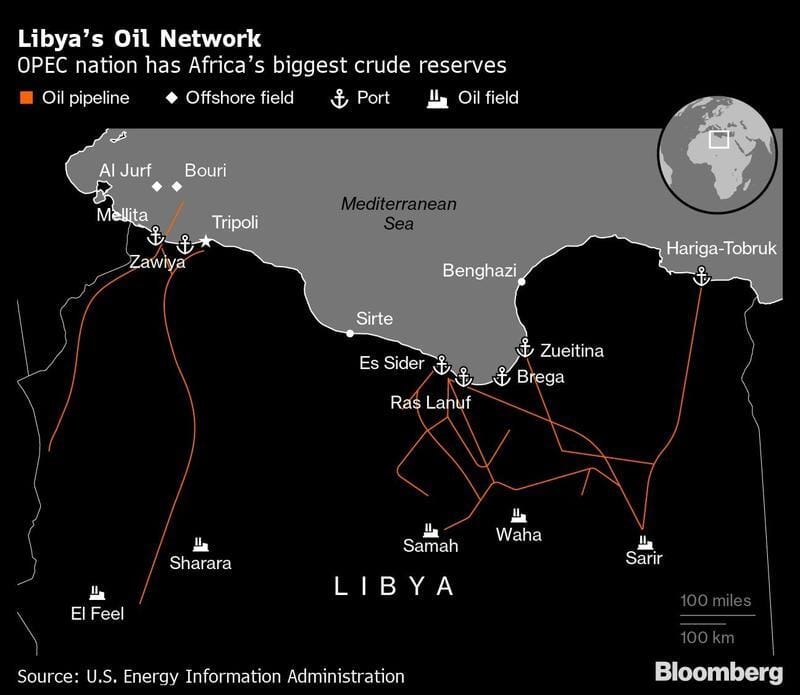
Source: Bloomberg
Reuters reported Thursday that the oil tanker Kriti Samaria has been cleared to enter Libya’s Zueitina port, where it will load 600,000 barrels of crude from storage. Oil exports from the region had been largely halted for over a week due to a political crisis. However, Libya’s legislative chambers have now reached an agreement to resolve the standoff, allowing exports to resume.

Pictured: Zueitina Port
The local union leader, Merhi Abridan, told Reuters that between 3,600,000 to 3,780,000 barrels are exported from the site on a monthly basis.

Interested in How We Make Our Charts?
Some of the charts in our weekly editions are created using Datawrapper, a tool we use to present data clearly and effectively. It helps us ensure that the visuals you see are accurate and easy to understand. The data for all our published charts is available through Datawrapper and can be accessed upon request.

