Reciprocal Tariffs
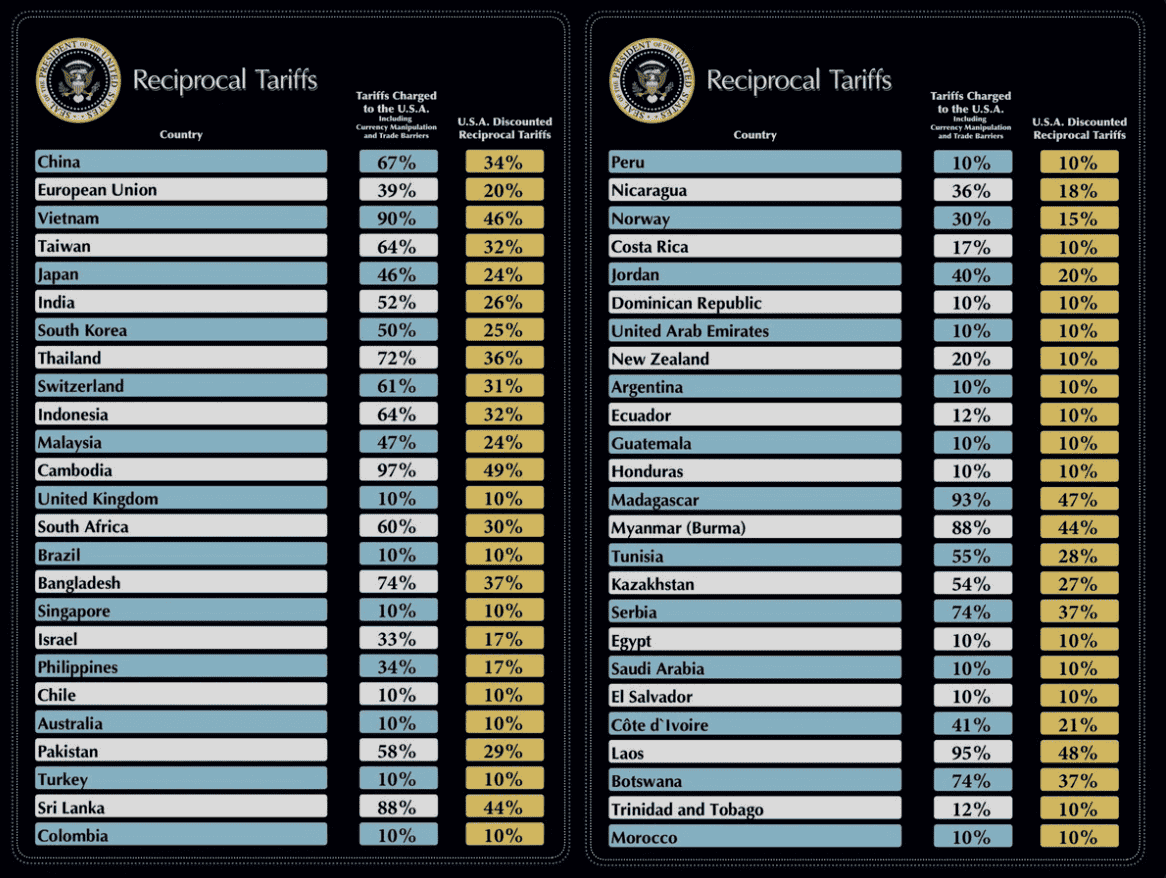
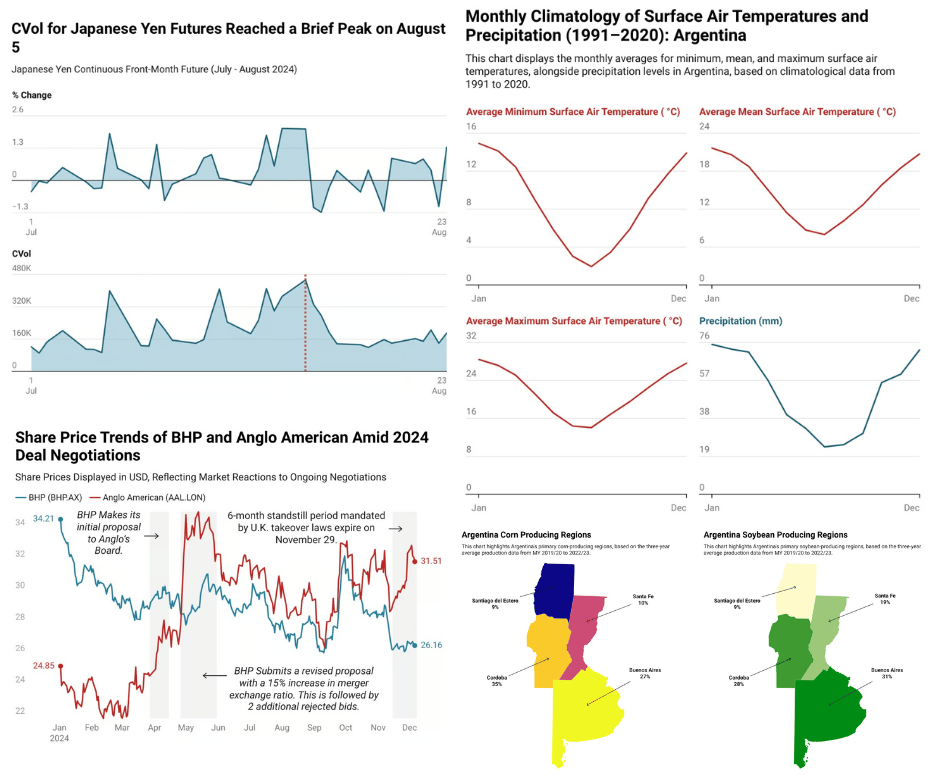
April 2nd, 2025 marked what many are calling “Liberation Day,” as the White House announced a sweeping set of reciprocal tariffs targeting the United States’ largest trading partners. The formula used to calculate the import taxes (at first seemed arbitrary) — was based on dividing each country’s trade deficit with the U.S. by their total exports— was widely criticized as a mathematical blunder as shown in the figure and explanation below by the American Enterprise Institute.
Nevertheless, the tariffs took effect Wednesday morning at 12:01 AM, much to the dismay of China, which explicitly stated it would not remain silent. In response, China announced retaliatory measures, imposing tariffs of up to 84% on U.S. goods—essentially an 84% tax on imports from the U.S. (though it’s unclear whether this applies broadly across all goods). What appears to be the brink of an all-out trade war between two economic superpowers has triggered broad liquidation across assets—from equities to Treasuries—pushing the Fear and Greed Index to a five-year low of 4 (on a scale of 0 to 100).
Global markets experienced sharp declines in early April, with the selloff intensifying on April 3. The day proceeding the announcement saw the S&P 500 dropped 4.88%, the Nasdaq Composite plunged 5.97%, and the Dow Jones Industrial Average fell 3.98%. European markets also saw losses, with the FTSE 100 down 1.6% and France’s CAC 40 shedding 3.3%. In Asia, Japan’s Nikkei 225 initially fell 2.8%. The downturn deepened on April 4, as the S&P 500 and Nasdaq Composite dropped further by 5.97% and 5.82%, respectively. Emerging market indices recorded their worst single-day declines since the 2008 collapse of U.S. investment bank Lehman Brothers. Markets remained under pressure until a rebound on April 9, when an announcement that reciprocal tariffs would be paused for 90 days (excluding China) appeared to calm investor nerves—likely an attempt to stop the bleeding in treasuries according to former JP Morgan strategist Marko Kolanovic . Most major U.S. indexes rallied more than 10% late into the day following the announcement before giving up a portion of the gains on Thursday.
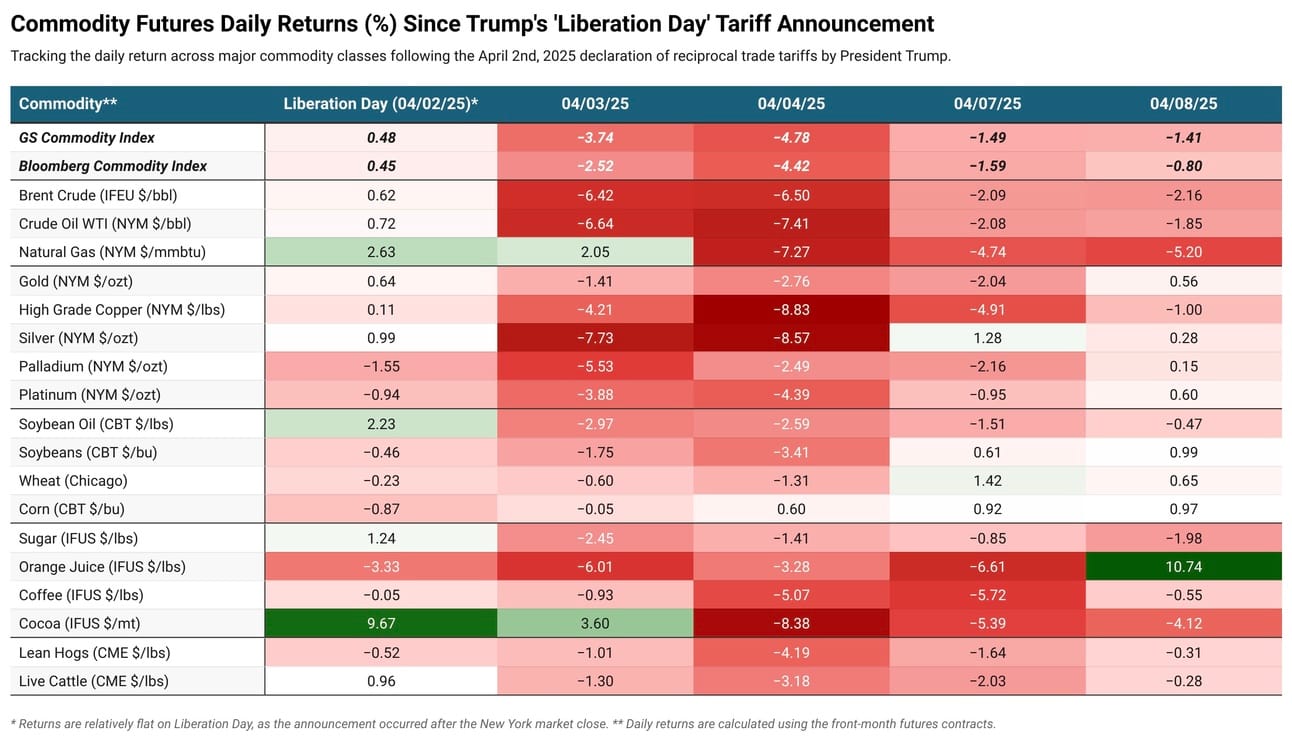
Commodities also faced sharp losses late last week before the rebound, with precious metals and energy leading the decline. The recent acceleration of OPEC+ production hikes, coinciding with “Liberation Day,” further pressured oil markets—sending both WTI and Brent crude prices below $60 per barrel. Soft commodities appeared to have fared better than food staples, with the front-month corn contract posting gains over the past week at the time of writing. Cocoa and coffee, already facing supply constraints, suffered losses of over 5% heading into last weekend. Top robusta producers Vietnam and Indonesia were hit with tariffs of 46% and 32%, respectively. Brazil, a leading exporter of arabica coffee and sugar, faced a 10% tariff, while major cocoa suppliers Ivory Coast and Ghana were targeted with tariffs of 21% and 10%.
The impact of tariffs has led some to adopt a “sky is falling” attitude, with JPMorgan raising the probability of a global recession to 60%—up from 40%—if President Trump follows through on the full plan he outlined last week. As the trade standoff between China and the United States intensifies—despite the temporary pause on reciprocal tariffs—the imposition of such measures is increasingly seen as a vicious, recursive cycle of tit-for-tat escalation. Commodities are proving just as telling as the sharp sell-off in U.S. Treasuries. Copper, often viewed as a barometer of global economic health due to its broad industrial use, has fallen 20% since its recent high on March 26. While a softer dollar (read more about the interaction between Tariffs and Exchange Rates) and temporary pause on the import tax has provided some temporary relief, major producers continue to temper expectations of a full cancellation.

Looking for unbiased, fact-based news? Join 1440 today.
Join over 4 million Americans who start their day with 1440 – your daily digest for unbiased, fact-centric news. From politics to sports, we cover it all by analyzing over 100 sources. Our concise, 5-minute read lands in your inbox each morning at no cost. Experience news without the noise; let 1440 help you make up your own mind. Sign up now and invite your friends and family to be part of the informed.

Metals
London and New York Gold Spread Tightens
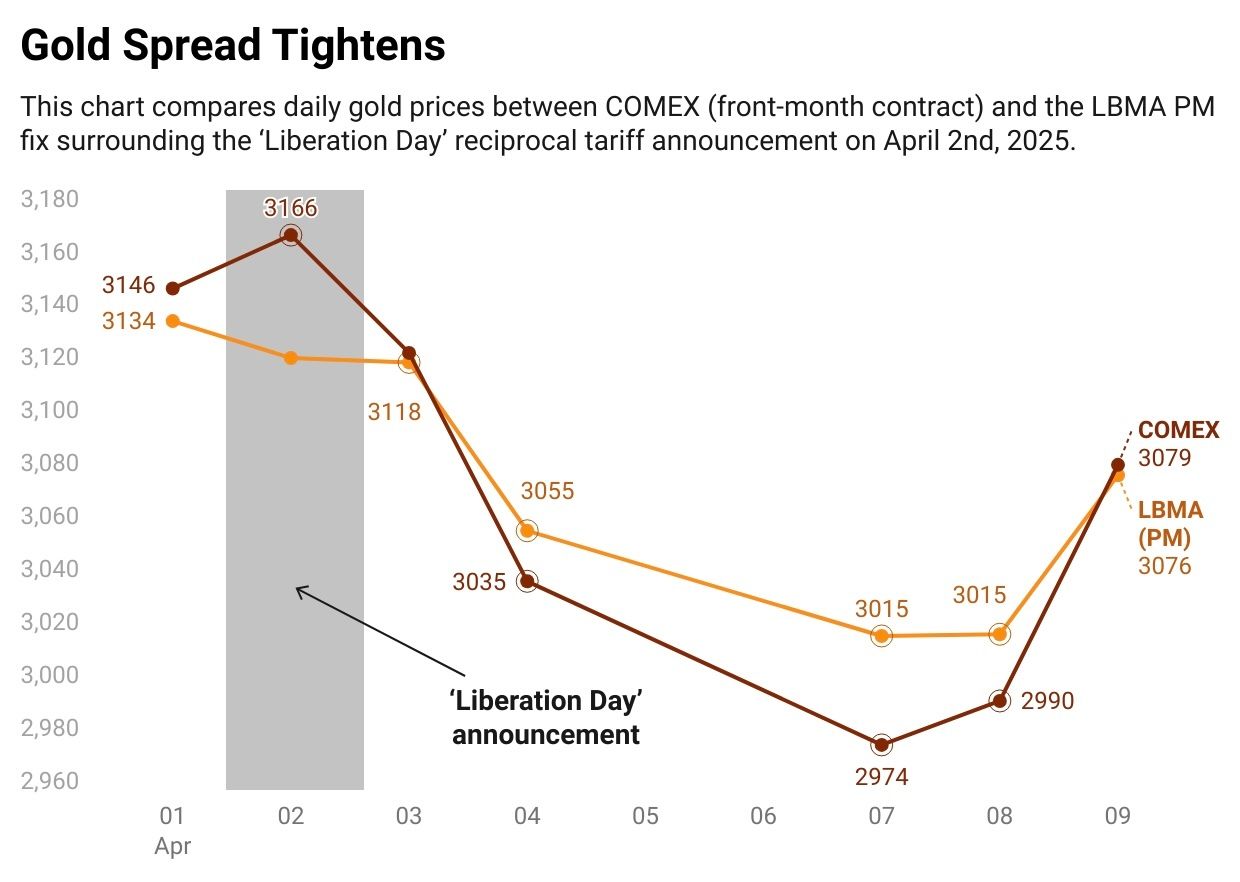
The most active Comex futures for precious metals narrowed their premiums over London spot prices on Thursday, following the U.S. decision to exclude gold, silver, and platinum group metals from the new import tariffs. The “Liberation Day” exemption of bullion eased concerns and dampened incentives for continued transatlantic shipments which you can read more about in our past edition: The Surge in U.S. Gold Premiums. The Comex gold premium dropped to around $20 per troy ounce—down from $43 the previous day and well above the usual spread of under $10. Silver and platinum futures also saw sharp declines in their respective premiums over London spot.
According to Reuters despite earlier speculation that precious metals might be targeted, many in the industry had bet on dislocation, triggering massive shipments to U.S. Comex warehouses. Between December and March, over $80 billion worth of gold, silver, and platinum were delivered under the looming threat of tariffs. Gold stocks in Comex warehouses reached a record 44.5 million troy ounces—up from 17.1 million in November when Trump was elected—now valued at $138 billion. These inventories represent five years of U.S. gold consumption and four years of silver demand.
Gold/Silver Ratio Reaches 5-Year High
Despite the narrowing spread in gold futures between New York and London, silver has borne the brunt of the recent selloff. Its underperformance relative to gold has pushed the gold/silver ratio above 100—its highest level since mid-May 2020. While gold has held up relatively well due to its safe-haven appeal, silver, with its heavier reliance on industrial demand, has struggled amid growing recession fears.
The gold-silver ratio serves as a valuable indicator of the long-term relationship between gold and silver prices, with gold typically acting as the leading driver. Research by Baur, Tran, and Lucey (2014) confirms a strong co-integration between the two metals over the period from 1970 to 2011, suggesting that, despite short-term fluctuations, their prices tend to move together over time. However, the study also finds that this relationship can be distorted during periods of financial crises and speculative bubbles. Adding to the pressure on silver, Kitco reported that economists are warning President Trump’s sweeping global tariffs could significantly slow economic growth, potentially tipping the economy into recession. Commodity analysts note that this looming threat is weighing heavily on key industrial commodities. Silver—despite its partial role as a monetary metal—is being dragged down alongside other risk-sensitive assets.

Energy
Oil at Sub $60 a Barrel
The brief reprieve in energy commodities following President Trump’s announcement of a 90-day pause on reciprocal tariffs quickly faded. On Thursday, front-month contracts for both Brent Crude and WTI sold off, falling below the key $60 per barrel support level. The renewed tariff concerns—already weighing on global oil supply—come as OPEC+ plans to accelerate output hikes by 411,000 barrels per day in May. This move aims to penalize members like Kazakhstan freeand Iraq for repeated overproduction. Once again, Saudi Arabia is asserting itself within the cartel, targeting so-called "free riders", see Okullo (2016) for more on the concept.
Despite the looming threat of a supply glut, Standard Chartered told OilPrice.com that they remain bullish on oil market fundamentals. They argue that the scale of the output acceleration is not significant enough to cause a Q2 surplus, especially given current market tightness. Additionally, the bank’s analysts believe the latest OPEC+ decision could help reinforce future production discipline and improve compliance with quotas. All else being equal, the choice not to delay output hikes further gives President Trump exactly what he was pushing for: lower oil prices. In theory, this should translate into lower by-product costs—particularly at the pump for U.S. consumers—though the pass-through isn’t always direct or guaranteed.
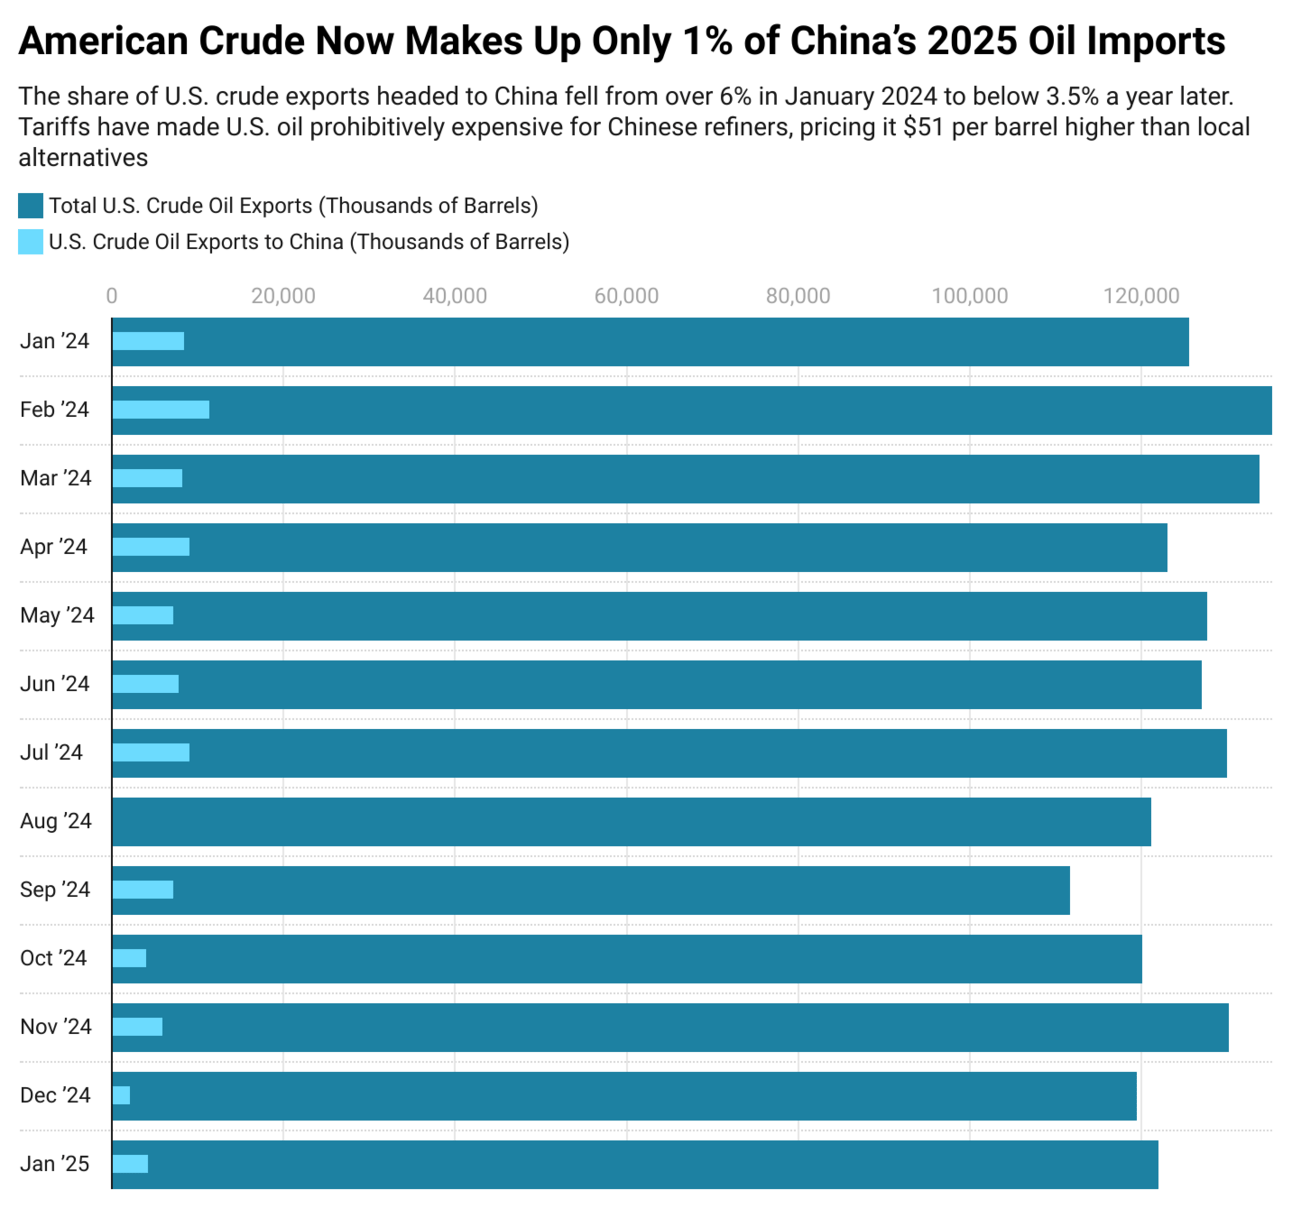
While most reciprocal tariffs remain paused, U.S.-imposed tariffs on China seem on track to hit 200% by the end of the week after a constant game of chicken between the two administrations. As trade tensions escalate, China is expected to halt imports of U.S. crude oil altogether. American crude has made up just 1% of China’s oil imports this year, but recent tariffs—125% on Chinese goods and 84% on American goods—have made U.S. oil prohibitively expensive for Chinese refiners, pricing it $51 per barrel higher than local alternatives. Analysts also report a sharp decline in U.S. LNG imports, with Chinese buyers reselling cargoes due to rising costs. Meanwhile, China is shifting its energy sourcing to the Middle East, where Saudi Arabia has cut prices to multi-year lows for Asian buyers.
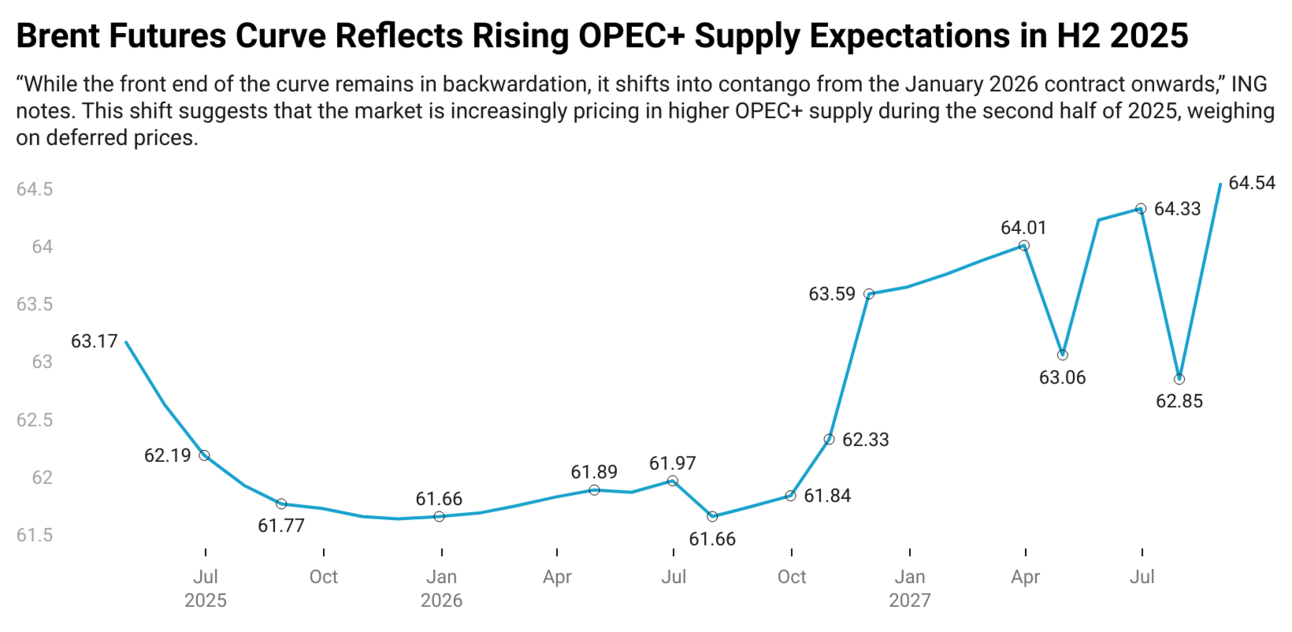
Source: FactSet
Crude prices remained under pressure on Thursday morning and continued to trade lower into the afternoon. Brent crude was down 4.12% at $62.78, while WTI crude fell 4.62% to $59.47. According to ING analysts Warren Patterson and Ewa Manthey, the ICE Brent forward curve is now signaling a better-supplied oil market—at least in parts of the curve. In their morning commodities update, they note: “While the front end of the curve remains in backwardation, it shifts into contango from the January 2026 contract onwards.” This shift suggests the market is increasingly pricing in higher OPEC+ supply during the second half of 2025.

Softs and Food Items
Following the April 2 tariff announcement, Chicago futures markets experienced a sharp decline, with soybean contracts dropping by 16–18 cents per bushel. Corn, wheat, and cattle futures also fell, reflecting investor concerns about reduced export opportunities and potential retaliatory measures. Soybeans were particularly affected due to China’s retaliatory 15% tariff, compounding earlier levies. Given that China is the largest buyer of U.S. soybeans, this exposed a major vulnerability in the U.S. agricultural sector.
China escalated its response by raising tariffs to 84% on key U.S. agricultural goods, including pork, beef, and soybeans. The European Union also imposed 25% tariffs on $23 billion worth of U.S. products. These measures directly undermined U.S. export competitiveness, prompting foreign buyers to shift to alternative suppliers like Brazil and Argentina, which were not affected by the trade tensions.
The tariffs also had domestic repercussions. Food prices rose 1.6% in the short term, with fresh produce increasing by 2.2%. When all 2025 tariff actions are factored in, food inflation is expected to reach 2.8%. Apparel and textiles faced the most severe impact, with a 17% price increase, indirectly affecting commodities such as cotton and other fibres.
Canada was largely spared from baseline tariffs on USMCA-compliant agricultural exports, maintaining tariff-free trade for most crops and livestock. However, existing tariffs on steel, aluminum, and certain non-USMCA imports like energy and potash, ranging from 12% to 25%, remained in place. Despite these exemptions, Canadian farmers still experienced pricing pressures due to global supply chain disruptions and the interconnected nature of commodity markets.

‘Liberation Day’ Research Already in Effect
The pace at which researchers are producing new insights is truly remarkable. On April 10th, Ignatenko and co-authors from the Norwegian School of Economics, The National Bureau of Economic Research and CESifo released a working paper analyzing the long-term effects of the recently announced "Liberation Day" tariffs. Below is a summary of their key findings, with a link to the full paper for those interested in learning more about the implications of reciprocal tariffs.
Key Findings from the Study:
Policy Announcement
On April 2, 2025, President Trump declared “Liberation Day,” implementing broad-based tariffs aimed at reducing trade deficits and revitalizing U.S. industry.Terms of Trade Effects
Tariffs can improve the U.S. terms of trade—but only if trading partners do not retaliate.Retaliation Matters
Any potential welfare gains vanish when other countries respond with reciprocal tariffs.Optimal Tariff Structure
Assuming no retaliation, the optimal U.S. tariff rate is approximately 25%, uniformly applied across all trading partners. This approach contrasts sharply with the USTR’s proposed structure, which varies tariffs based on bilateral trade deficits.Welfare Impact
When trading partners retaliate optimally against the USTR’s approach, the U.S. experiences a nearly 1% welfare loss, while partner countries effectively offset their initial losses.Global Consequences
A full-blown tariff war reduces global employment by 0.5%.Trade Deficit vs. Efficiency
Although the tariffs succeed in reducing the U.S. trade deficit, they result in deadweight losses, emphasizing the inefficiency of protectionist trade policy as a method for deficit reduction.

Learn AI in 5 minutes a day
What’s the secret to staying ahead of the curve in the world of AI? Information. Luckily, you can join 1,000,000+ early adopters reading The Rundown AI — the free newsletter that makes you smarter on AI with just a 5-minute read per day.

Congratulations on making it to the end, while you’re here enjoy these other newsletters and be sure to subscribe to The Triumvirate before you go.

Interested in How We Make Our Charts?
Some of the charts in our weekly editions are created using Datawrapper, a tool we use to present data clearly and effectively. It helps us ensure that the visuals you see are accurate and easy to understand. The data for all our published charts is available through Datawrapper and can be accessed upon request.


